
What's happening to generic drug prices? November 2018 NADAC Survey update
It’s the evening before Thanksgiving, which means it’s time to:
Go to the gym to feel less guilty about what’s about to go down tomorrow;
Prepare to wake up at 3am on Friday to (literally) fight hoards of people to buy stuff that your kids will get bored with by December 28th;
Develop strategies to politely exit political conversations with your Facebook-informed uncle;
Analyze the change in generic drug prices!
A few notes about this month’s National Average Drug Acquisition Cost (NADAC) survey update before we get into the takeaways:
First, as explained in our initial release of this report, we use Medicaid State Drug Utilization Data (SDUD) to help “size up” the latest monthly change in generic drug invoice prices. Up until today’s report, we have only had access to Q1 2018 utilization data, so we have used this one quarter as the basis for this analysis. However, on October 24th, CMS published Q2 2018 Medicaid utilization data. As such, with this update, we are now using all of the first half of 2018 as our base drug utilization, and annualizing off of this base. If you were curious why some of the historical numbers have changed – this is why.
Second, we learned something new about Tableau Public! But before we let you in on this random bit of knowledge we gained yesterday, we would be remiss (especially on the day before Thanksgiving) if we did not express our immense gratitude to the folks at Tableau for creating and hosting Tableau Public, which is free online software that makes it easy for anyone to post visualizations for the public to search, interact with, and learn from. At 46brooklyn Research, we are adamant that our work should be free for all to access so we can all learn about this supply chain together, and as a result, have a more constructive, fact-based debate about how to better control drug pricing. Tableau Public allows us to share our work for free. For that, we would could not be more grateful.
Disclaimer: We are not in any way compensated by Tableau. This sort of thank you was just long overdue.
Anyway, what we learned this week (Figure 1) was that you can’t upload a viz that has more than 15 million rows of data! After adding the extra quarter of utilization data, we blew through that threshold and were left scratching our heads on how to get you this visualization. And yes, you read that correctly: we are operating off of more than 15 million rows of drug pricing data.
Figure 1
Source: 46brooklyn Research
The good news is that with some smarter database prep, we were able to reduce the size of the database without any impact to the numbers. Problem solved (for now)! Time to get into the results.
$169 million in annualized savings
November was another very good month for generic deflation, at least based on Medicaid’s overall first half 2018 drug mix. When we take the price changes across all generics, apply to Medicaid’s mix, and annualize, we get a $169 million reduction in overall Medicaid ingredient cost. You can see how it all adds up in our NADAC Change Packed Bubble Chart, embedded below.
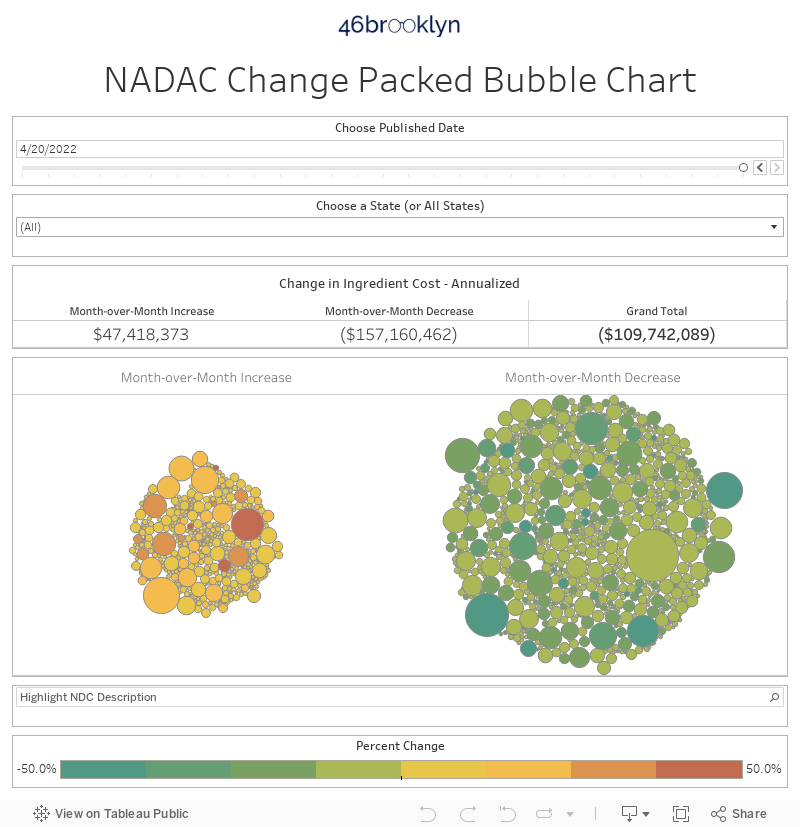
This month showed more excellent progress on the drug deflation front, especially in the context of our prior analyses that examined drug price changes in the context of Medicaid’s drug mix. To see how this month compared to prior months, just toggle through the dates in the above viz.
Another quick aside: Did you know you can embed any of our visualizations in your website? All you have to do is click on the “share” icon in the bottom right of the visualization and copy the embed code. All we ask is that you source 46brooklyn Research.
Both Quantity and Quality
In this week’s survey results, there were 2,972 unique generic “NDC Descriptions” (e.g. Abacavir 300 MG Tablet, Tizanidine HCL 2 MG Tablet) that experienced a price change. Out of those, 1,741 or 58.6% decreased in price, up from 54.2% in the prior month’s survey. Drilling down a bit deeper, 340 NDC Descriptions experienced a 10-20% decrease in price, up from 234 last month, while 146 NDC Descriptions experienced a 10-20% increase in price, down from 255 last month (Figure 2). So this month’s pricing update gave us both quantity and quality – more generic drugs that went down in price (quantity), and within this population, a whole lot more that went down by a meaningful amount (quality).
Figure 2
Source: Medicaid.gov, 46brooklyn Research
Happy Thanksgiving!
Due to the holiday, we’ll keep this update short and sweet. As always, there are all sorts of interesting stories down at the drug level, but they are not going anywhere. They’ll be here for all of us when we get back from spending much-needed time reflecting on all of the many things for which we are grateful. Happy Thanksgiving!