
The Super Special Drug PRicing Dashboard
Explore the “value” of Average Wholesale Price (AWP) effective rate guarantees
In the United States, drugs aren’t really priced to sell as is, but instead are priced with the idea that the list prices are the starting point for a negotiation. As a result, the relation of the list price of a drug relative to its actual cost can be widely varied and inconsistent.
Because most prescription drugs are purchased through health insurers and more specifically, their pharmacy benefit managers (PBMs), our exposure to the cost of a medicine as patients or plan sponsors is heavily dependent on the negotiated rates achieved by PBMs. While that may sound straightforward, this is drug pricing in the US, silly.
Rather than PBMs working to encourage drug manufacturers and pharmacies to lower their inflated prices, PBMs instead negotiate off those list prices – often incentivizing manufacturers and pharmacies to raise their prices even more.
This dynamic may not be harmful if rather than PBMs billing plan sponsors based on the inflated list prices of medicines, they instead charged plan sponsors based on the actual cost. But alas, most government and commercial payers get their PBM deals packaged up as big discounts to artificially inflated and disconnected list prices. And their list price benchmark of choice – despite years of litigation after its broken nature – is average wholesale price (AWP).
That brings us to the 46brooklyn Super Special Drug Pricing Dashboard.
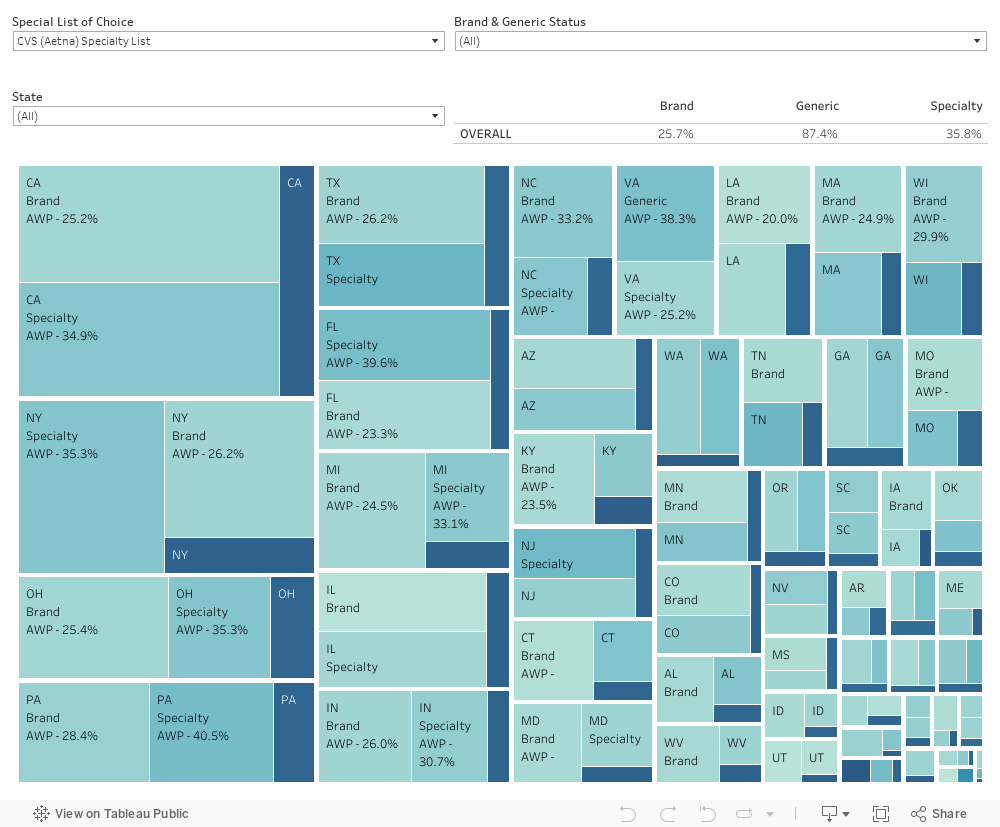
Since most payers are experiencing cost through the lens of AWP-linked discount guarantees from PBMs, we have created this dashboard as a means of contextualizing their perceived value through the perspectives of the three largest PBMs.
See, rather than charging payers on a drug-by-drug, cost basis, PBMs throw drugs into three primary buckets that they label as brand, generic, and specialty. While that may sound straightforward, we again remind you that this is drug pricing in the US, silly.
These three categories are not as objective as they may seem, as PBMs have broad flexibility to categorize medicines in whichever buckets they so choose, with the only limits being how they elect to define those buckets in their contracts with payers. But PBMs have a track record of manipulating those definitions, thus rendering many of their guaranteed discounts off of artificially inflated prices, at times, not worth the paper they’re printed on. And since each PBM has latitude to categorize drugs as they please, there is broad inconsistency between companies, making comparisons of their supposed deals tricky – even if they’re willing to share their itemized receipts with plan sponsors.
The purpose of this dashboard is to let users explore the the “value” that AWP-based effective rate contracts offer in relation to PBM flexibility on setting “what is” and “what isn't” a brand, generic, and/or specialty medication. By utilizing Medicaid utilization data as a proxy for utilization and expenditure data, the dashboard enables users to explore how context shapes conversations around drug pricing more then we might think.
Before you use this dashboard we highly recommend reading the accompanying report that was released in conjunction with the tool, to ease understanding of what the data visualization is showing.
Data Sources
Big 3 PBM Specialty Drug Lists downloaded in April 2023 (CVS / Aetna, Cigna / Express Scripts, and Optum / UnitedHealthcare)
How we Created our Dataset
46brooklyn's visualization tool of choice = Tableu Prep
Download PBM specialty drug list, use string matching algorithm to identify national drug codes (NDCs) for products based upon the listed names on the PBM specialty list.
Develop an average AWP per NDC per quarter (weighted based upon days in quarter). Do the same for WAC.
Join AWP and WAC prices to SDUD on a quarter, year, and NDC-basis.
Identify FDA license application types of all NDCs.
Flag products as specialty if they appear on individual PBM lists. Flag products as brands if they’re not already flagged as special and approved by FDA via NDAs or BLAs. Flag all other products as generics for the PBM.
Develop a brand / generic flag outside of PBM lists based upon FDA application types where NDAs and BLAs are flagged as brands and all others are flagged as generics.
Join SDUD+AWP+WAC data set to PBM flags based upon NDC.
Calculate effective rates for each PBM flag group based upon taking the Total Medicaid Paid Amount Divided by the Total AWP (units dispensed * AWP per unit of E=each NDC) within each flagged group.
How to Use
Choose a state (or view all states).
Choose which PBM list will be evaluated.
Toggle between brand and generic status to see the overlap of historic brand and generic products into the specialty groups of each PBM.
Observe the impact to AWP guarantees despite no underlying change to actual Medicaid expenditures.
v 1.1 - posted May 9, 2023
For full release notes click here.