
Gobble, Gobble — generic drug pricing deflation is served
Grateful for Generic Drug Deflation
Last month, we reported on the hiatus to the summer-long generic drug deflation-fest. We calculated $81 million in annualized inflation (based on Medicaid’s drug utilization), a hefty number for sure, but not in comparison to the more than $400 million in annualized generic acquisition costs that were wiped out over the summer.
Here we are one month later and those generic drug rage machines are back at it, partying it up like University of Texas frat boys at ZBTahiti. This month, generic drugs collectively delivered another $80 million in deflation, almost fully offsetting the savings they gave back last month, giving us something to celebrate in the middle of an otherwise disappointing Thanksgiving week.
What Happened?
If you are really looking to energize your virtual family-and-friends gatherings this week, be sure to drop the big news that on November 17, CMS published its latest update to the National Average Drug Acquisition Cost (NADAC) database. Since your Uncle Jim may have been spending more time imbibing conspiracy theories than the nuances of prescription drug pricing benchmarks, you can share with him that NADAC is the best national public database of surveyed pharmacy invoice costs to acquire prescription drugs. In other words, if you are looking to understand what pharmacies are paying to purchase drugs from their wholesalers each month (before rebates), and you don’t want to cough up a boat load of money to pay for it, NADAC is where you must go.
As we’ve discussed at length, NADAC is lagged by roughly two months. So the survey prices we just received this November reflect pharmacy invoice costs from September.
As already mentioned, today’s key takeaway is our finding that this month’s NADAC price changes equated to $80 million in annualized generic drug deflation based on Medicaid’s drug utilization. For regular readers of this monthly “NADAC newsletter,” we know what you are thinking… “oh, it’s probably those ADHD generic drugs (i.e. methylphenidate) these 46brooklyn folks write about nearly every month. Those drugs’ prices whipsaw back and forth each month, so that probably explains this month’s drop.”
That was our first assumption when we saw the numbers, but it’s not the main driver. We removed methylphenidate from the analysis and annualized deflation was still $60 million. Rather, deflation is being driven by a handful of new partygoers this month – generic drugs we haven’t highlighted before whose prices are nose-diving like Boba Fett into a Sarlacc pit.
Want to learn more about these new faces on the generic drug deflation party scene? Then read on…
1. Unweighted price change analysis is deflationary
Each month, we first look at how many generic drugs went up and down in the latest month’s survey of retail pharmacy acquisition costs, and compare that to the prior month (Figure 1).
Basically, the quick way to read Figure 1 is to look for blue bars that are taller than orange bars to the left of the dotted line, and exactly the opposite to the right of the dotted line. That would indicate a good month – more generic drugs going down in price compared to the prior month, and less drug prices going up.
Figure 1
Source: Data.Medicaid.gov, 46brooklyn Research
That largely happened this month. When we look at drugs that moved one way or another by single-digit percentages, there were 10% more drugs that decreased in price by 0-10% and 2% fewer drugs that increased by 0-10%.
Turning to the drugs that moved by double-digit percentages, 31% more drugs decreased by more than 10% while 25% fewer drugs increased by more than 10%. Not the best unweighted deflationary showing we have ever seen… much like when someone puts pine nuts in an otherwise delightful dish of stuffing, it’s solid but could be better.
2. Weighted Medicaid generic deflation swings back to $80 million
As we’ve written in prior updates, knowing the drug price changes alone are not enough. We need to apply utilization (drug mix) to the price changes, which is the purpose of the NADAC Change Packed Bubble Chart (Figure 2). We use Medicaid’s 2019 drug mix to arrive at an estimate of the total dollar impact of the latest NADAC pricing update. This helps quantify the real impact of those price changes from a payer’s perspective (in our case Medicaid, individual results may vary).
The green bubbles on the right of the Bubble Chart viz (screenshot below in Figure 2) are the generic drugs that experienced a price decline in the latest survey, while the yellow/orange/red bubbles on the left are those drugs that experienced a price increase. The size of each bubble represents the dollar impact of the drug on state Medicaid programs, based on utilization of the drugs in the most recent trailing 12-month period. Stated differently, we simply multiply the latest survey price changes by aggregate drug utilization in Medicaid over the past year, add up all the bubbles, and get the total inflation/deflation impact of the survey changes.

Figure 2
Source: Data.Medicaid.gov, 46brooklyn Research
Overall, in November there was $73 million worth of inflationary drugs, offset by $153 million of deflationary generic drugs, netting out to a very robust $80 million of deflation for Medicaid. The story only gets more interesting if you click on Figure 2 (which will take you to the interactive dashboard) and start hovering over the large green bubbles. Many of these are the new faces (at least when it comes to this monthly report) to the generic drug deflation dinner table. We’ll touch on a few of them in more detail in this report. But first, let’s check in on what happened to aggregate year-over-year generic deflation.
3. Year-over-year generic oral solid deflation climbs back up above 15%
Ever since last June, we have been tracking year-over-year generic deflation for all generic drugs that have a NADAC price. We once again weight all price changes using Medicaid’s drug utilization data. Beginning in August 2019, we had been seeing a gradual compression in deflation (Figure 3). But oddly enough, as the pandemic started, this trend started to reverse. After last month’s step back to 13%, oral solid generic deflation climbed to 15.2% year-over-year (YoY) this month, solidly above its average over the past 24-months. Deflation on all generics increased slightly to just under 12%.
Figure 3
Source: Data.Medicaid.gov, 46brooklyn Research
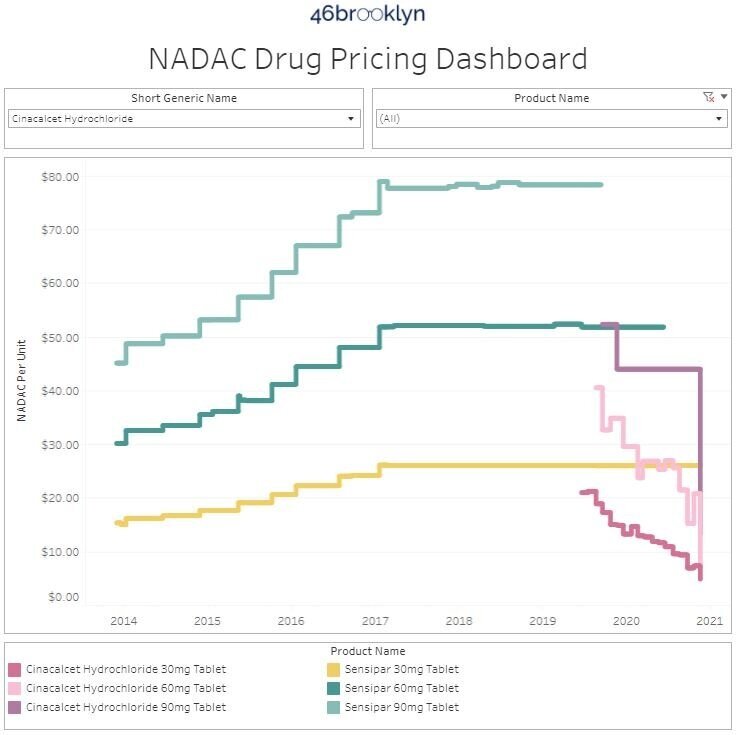
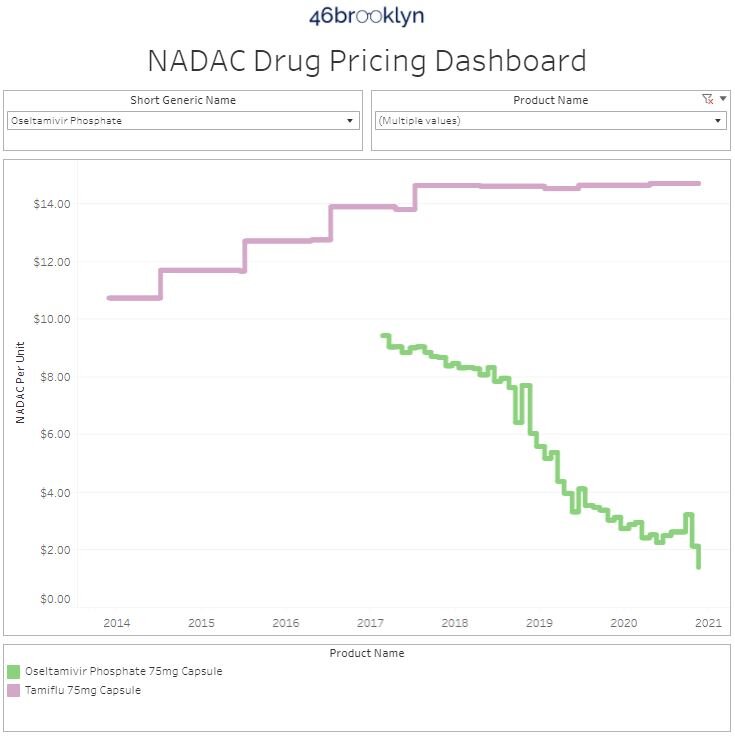
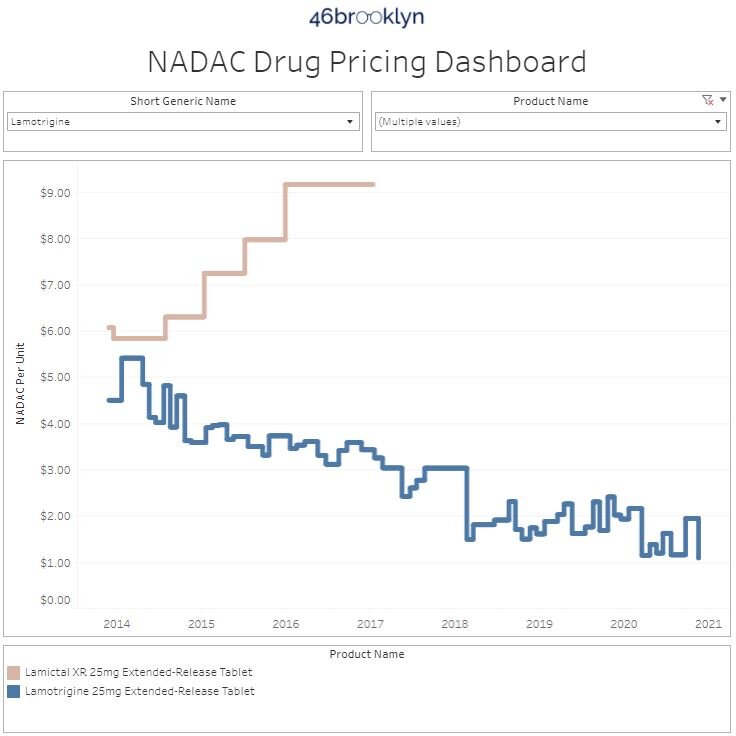
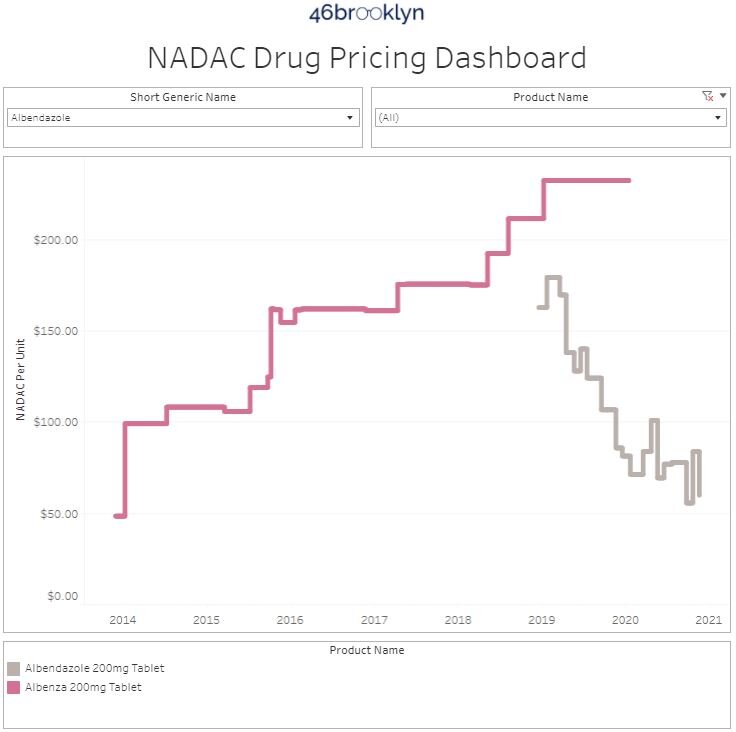
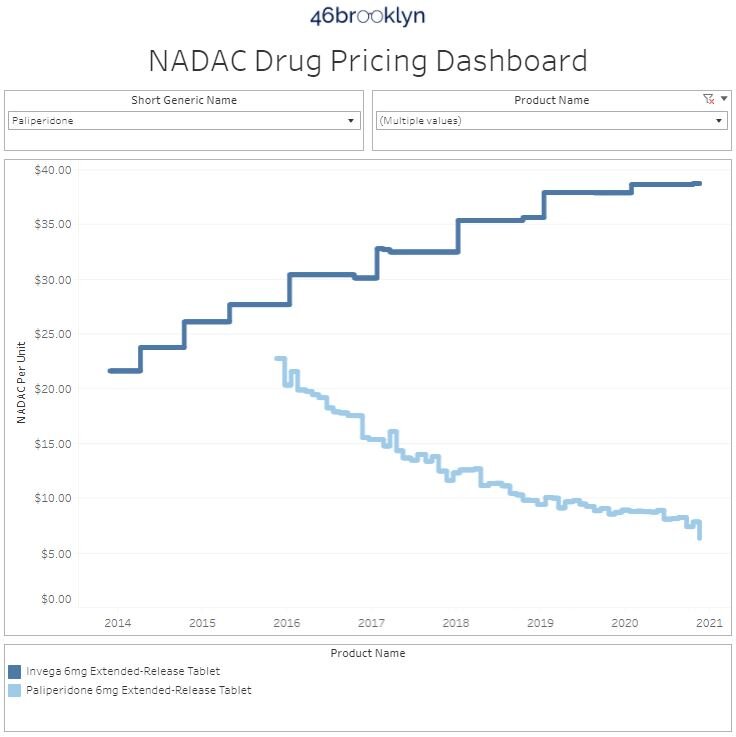
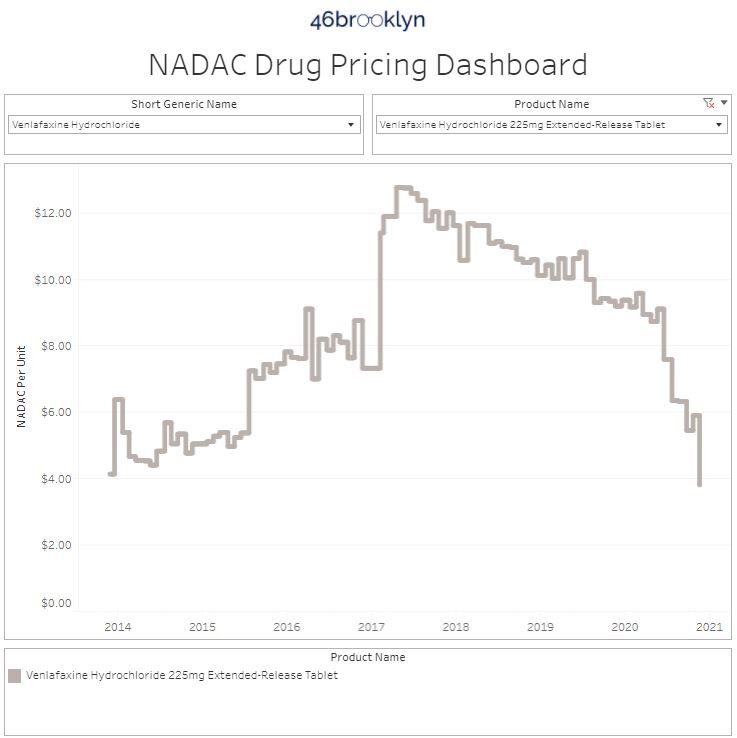
4. New faces to the generic deflation dinner table
With the holiday season upon us, and most of us hopefully forgoing our normal travel plans, we decided to try something different with this update. Rather than have to introduce you to each drug individually via lengthy text, our holiday gift to you this year is to skip all that and instead just show you. To that end, we made a gallery of all their pricing trends (Figure 4 below) for you to flip through and see for yourself. Hopefully the half-dozen we’ve selected give you a sense for just how widespread the generic deflation cheer is this time of year.
10. ADPIT highlights upward price movements on some popular (but still very cheap) generics
Finally, let’s check in on our Abnormal Drug Pricing Increase Tracker (ADPIT) and see what it has to say about this month’s data. As a reminder, ADPIT takes all of the NADAC prices for one drug over any given 52-week period, ranks them, finds the 90th percentile for the price, and then compares the current price to that 90th percentile price. If the current price is above the 90th percentile, we consider the current week’s price to be “abnormal” and add it to the list for you to peruse. Then we do this for another 20,000 or so drugs for good measure to complete the list, shown in Figure 5.
If this is the first time you are seeing this, we include the number of annual Medicaid prescriptions for each of these abnormally priced drugs, and then two metrics we created – one called Relative Impact Ratio (RIR) and another called Relative Impact Score (RIS). RIR simply tells you how far above the 90th percentile a drug’s price currently is (i.e. Famotidine at 1.24 means its 24% above its T-52 week 90th percentile price). RIS multiplies the number of annual Medicaid prescriptions by (RIR - 1) to size the impact of the “pricing abnormality” (for famotidine, 24% x 1,658,041 prescriptions = 555,919). Add up all the RIS for all of the drugs each week, take the four-week moving average, and you get the chart in bottom right of Figure 5 (which sizes the aggregate weighted impact each week). We then divide the bottom right chart into drugs with active ingredients in ongoing COVID-19 clinical trials, and all other drugs. Check out our interactive ADPIT tool here, and find more information on how to use it here and here.
Figure 5
Source: Data.Medicaid.gov, ClinicalTrials.gov, 46brooklyn Research
Overall, the dashboard continues to paint a very healthy picture for the generic marketplace, although less so than prior months. While the chart on the bottom right shows that the aggregate RIS is at historically low levels, the leaderboard does now highlight some high utilization drugs that have crossed above through their T-52 week 90th percentile price. Notably, out of the top 10 drug ranked by RIS, six of them sold over one million prescriptions in Medicaid in 2019.
We’re not talking about obscure drugs like promethazine syrups anymore… the drugs at the top of this month’s ADPI list are “celebrity” generics like:
generic Pepcid (famotidine) - used to treat heartburn
generic Singular (montelukast) - used to treat asthma
generic Daxbia (cephalexin) - used to treat bacterial infections
generic Flagyl (metronidazole) - used to treat fungal infections
generic Ambien (zolpidem) - used as a sleep aide
To be clear, all of these drugs remain very inexpensive. So please, we beg you, do not go out and stockpile any of them like most folks are (again) with toilet paper and paper towels. This tool is simply meant to highlight abnormal inflationary pricing movements. These pricing movements could signal a supply shortage. Or they could just be highlighting generic drugs that are far too cheap, and are simply correcting to more sustainable prices. Or they could just be loosening their belts to make room for all that consumed turkey.
In the spirit of thanks, we’d like to give an extra helping of mashed potatoes and gravy to John Wilkerson at Inside Health Policy for highlighting last month’s NADAC analysis showing generic drugs creeping back up.
We’d also like to serve up a hearty slice of pecan pie to Matt Pilon at Hartford Business Journal for featuring 46brooklyn president Eric Pachman in a discussion on the complicated nature of the prescription drug supply chain and its structure that creates winner and losers within the payer market and patient population.