
Welcoming a New Year with new drug prices
Starting off with a (more muted) bang!
Those of us at 46brookyn like to spend the holidays the same way we suspect most of you do – gathering with family, watching bowl games, cleaning up messes (and re-messes) left by the kids, losing patience with winter earlier than the prior year, and, of course, waiting for the latest drug pricing data to get published.
Ok, maybe we’re the only ones that like the later part, but we needed it this year (especially with how our favored teams did in those aforementioned bowl games).
This year has proven to be little different from past years. In keeping with tradition (for as long as drug pricing benchmarks have been a tradition), brand drug manufacturers big and small took list price increases (as measured by wholesale acquisition cost, or WAC) at the start of the year. Technically most prescription drug price increases occur in either January or July each year, but the greatest number take place in January (and thus, January gets all the attention). By our counts, since 2018, more than 60% of all brand drug list price increases that occur throughout the course of each year are implemented in the month of January.
In turn, we anxiously await the publication of those price changes so we can keep with our tradition of informing you all about them, as they represent an important layer of the broader drug pricing onion. Thankfully, over the years, the work of unlocking the data of drug pricing behavior has become easier for us thanks to our friends at Elsevier and our supremely named Brand Drug List Price Change Box Score visualization. And well, when we ran those numbers at the start of the week, we saw a more muted kick off to the tradition of annual list price changes (more on that later).

Now before we get into the numbers, bear in mind that in our Box Score, in this analysis, and in all research that relies on list prices for medicines, it’s important to remember that list prices are just one part of the drug pricing puzzle. In fact, you can think of list prices as the border pieces of an actual puzzle. They are the starting point that generally frames the broader picture, but there many more pieces to the puzzle that are needed to decipher exactly what’s happening within the frame – or in this case, what’s happening underneath the list price.
As was pointed out this week by fellow drug pricing Jedi Adam Fein over at Drug Channels, while these list prices are growing, when looking below the surface of the list prices of these drugs, the actual net prices of many of those medicines are actually in a state of decline. This means that while list prices may be rising, the financial fruits that are borne out of those increases are increasingly being harvested by drug supply chain intermediaries and more importantly, the full value of the concessions made off of list prices may not be getting passed along to plan sponsors and patients.
We offer this caveat emptor (so to speak) in an attempt to properly introduce the data we discuss below and contextualize some of its limitations as others seek to better understand that the fumes emanating from the odorous US drug pricing onion arise from the entire onion and not just its outer shell.
So with that said, be sure to check out our Box Score today and throughout the month as we continue to update the latest brand drug list price changes. Now let’s dig into what we’re seeing during the earliest days of 2023.
3 . . . 2 . . .1 . . . 450
While our team was able to get a sneak peek of some of the early brand drug price increases last week, it turned out that we rung in the New Year on January 1 off with 452 list price increases and 2 list price decreases (450 increases in the net). And while that may sound like a lot – and it could be argued that it’s a lot – it is not as much as we saw in 2022 (540) or 2021 (602). To be more specific, Figure 1 shows that in comparison to other January 1sts, 2023 isn’t starting off on too bad a foot (from a numerical count standpoint). Note that January 1st is hardly indicative of how many list price increases will be taken in January (or Q1 for that matter). We’re talking about it only because we can’t yet know how the rest of January will actually play out.
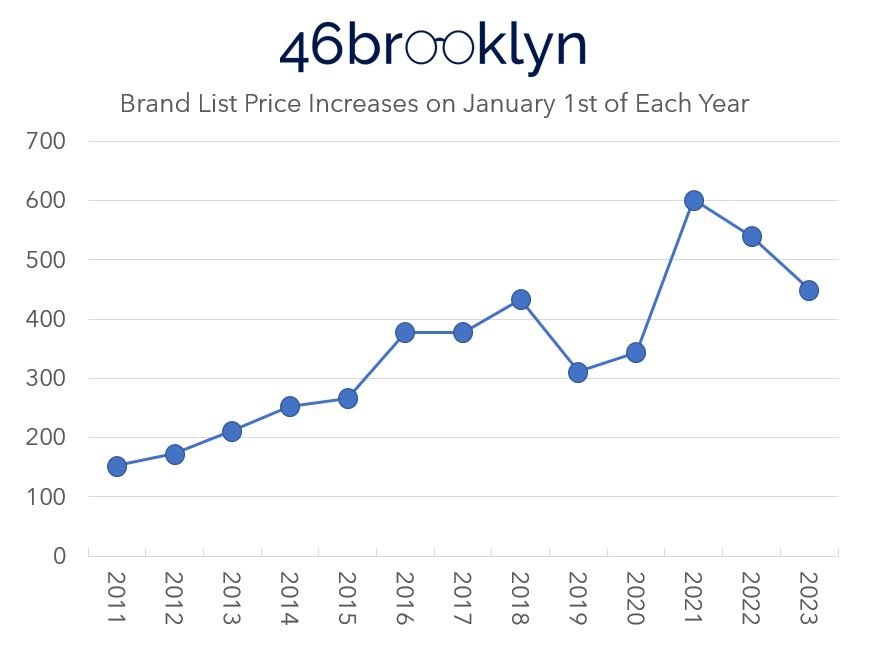
Figure 1
Source: Elsevier Gold Standard Drug Database, 46brooklyn Research
Of course, we’d be remiss if we didn’t take a second to look back on 2022 before getting too deep into the 2023 price increases. It turns out that 2022 finished the year with just over 1,400 brand list price increases (1,425 to be exact). That number is higher than the number in 2021 (1,219), and 2020 (994). In fact, you’d have to go all the way back to 2015 to find a year with more (2015 had 1,508). When we started the Brand Box Score, we remarked on how over the last decade, the number of brand list price increases in a year were declining (Figure 2). Well since making that observation, every single year has broken the mold and been higher than the year before (2022 being no exception). More so, we are increasingly noticing that the pace of increases appear to be accelerating (at least in relation to prior years). What we mean is that 2021 had more list price increases than any year since 2018 (a three-year gap), but 2022 had more price increases than any year since 2016 (a seven-year gap) (Figure 2).

Figure 2
Source: Elsevier Gold Standard Drug Database, 46brooklyn Research
Counts are great and all, but to be honest, all that counts are tracking are the number of times a brand drug list price changes. That doesn’t tell us anything about the price change itself other than the simple fact that it happened. How much of a change was it? What was the impact of that change? How does the change compare to prior behavior or to what is occurring with other medicines? All of this context matters.
What tends to get the attention more is the actual price increases themselves. Over time, the weighted average (based on Medicaid utilization data) and the median brand list price increase behavior has, generally, been less extreme. A decade ago, it wasn’t uncommon for the average price increase to be in the low double digits (>10%). As can be seen in Figure 3, the weighted average has declined every year since 2013, except last year (2022). The median has been on a steady decline since 2016.
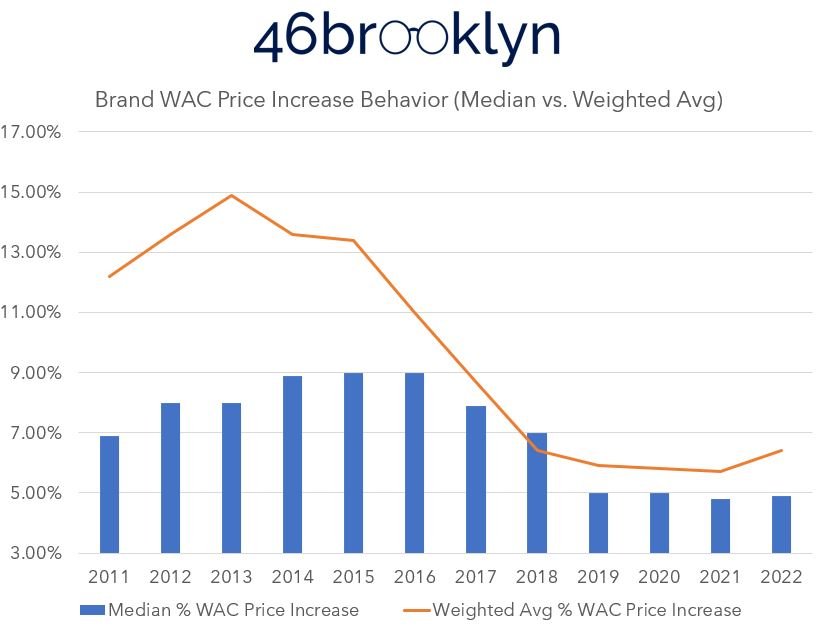
Figure 3
Source: Elsevier Gold Standard Drug Database, 46brooklyn Research
As you’ll be able to see in Stat Box #7 of our Box Score, some of the more noteworthy list price increases based on impact to Medicaid at the start of 2023 (if rebates and discounts aren’t keeping pace with list price growth) are drugs like Imbruvica (↑6.2%), Farxiga (↑3.0%), Jardiance (↑4.0%), Biktarvy (↑5.9%), Triumeq (↑5.9%), and Vyvanse (↑5.0%).
However, as mentioned above, we’d be remiss if we didn’t mention that all we’re doing is tracking list price behavior here. Plenty of known (as in we know they exist; not to the degree they exist) price concessions occur behind the scenes that lower the price below the list price to the net price. But, we’ve yet to crack the code as to how to get those transparently into the public domain at a granular level (like we have with list prices); so we’ll just acknowledge that they exist, stress the importance of accounting for them, complain about the lack of transparency, and move along for now.
The question everyone is asking: What about the Inflation Reduction Act?
Arguably the biggest change from 2022 to 2023 in the drug pricing world is the passage of the Inflation Reduction Act (IRA). As a reminder, the IRA makes substantive drug policy changes in a number of ways, but most notably by allowing Medicare to engage in selected drug price negotiation. It also creates a Medicare drug rebate program that will penalize drug manufacturers for taking price increases greater than the rate of inflation. Inflationary rebates are nothing new in the drug pricing world. The Medicaid Drug Rebate Program (MDRP) has had them in place since 1993, and most commercial rebate arrangements will contain “price protection rebates,” which constrain how much a drug’s price can increase over time (with the goal to minimize the price increase behavior – a la inflationary rebate). The difference is that outside of private Medicare rebate negotiations by health plans and their pharmacy benefit managers (which occurred historically), the federal government will now get these protectionary rebates themselves for Medicare. Said differently, the more things change, the more they stay the same (we’re just moving the money around).
Inflation has been getting a lot of attention over the last year, and we are certainly not the experts to tell you what drug manufacturers are thinking in regards to inflation.
But let’s pretend that we are.
On the one hand, drug manufacturers, like everyone else, are facing higher costs of business (inflation). Labor costs are up, supply costs are up, and all of that puts pressure on these publicly traded companies’ bottom line. At the same time, drug manufacturers are encountering new pressures to lower drug costs (everyone wave at CMS’ and Medicare’s upcoming price negotiations). We don’t think it’s any secret or stretch to assume the negotiations are intended to lower net drug prices further in the Medicare program than they’ve otherwise been. Further, manufacturers are facing increased consolidation among their PBM purchasers through recently erected rebate alligators aggregators, growth of the Medicaid and 340b programs (where net prices are at their lowest; see Best Price clause of the MDRP), and a number of other factors that are putting pressure on net revenues achieved by drugmakers below their list prices.
So – not to sound overly sympathetic here – by our estimation, drug manufacturers are facing immense pressures from both sides of the ledger (costs are up, and their ability to raise prices to make up for added costs and other industry dynamics may not be there).
Things are going to be different – really different – this year than they’ve been in recent memory for drug manufacturers. It is, at least in our estimation, likely that within this unknown, there won’t be one strategy employed to grapple with the impact of the IRA (and inflation, and the drug development pipeline, and the generic/ biosimilar launches this year, etc.). Rather, there will be many different strategies until inevitably a new normal is established (and results become more predictable). Said differently, are we to presume we have enough insights into what drug manufacturer pricing strategies were before the IRA to reasonably predict what they’ll be after the IRA? Even if we did, we should always, always, always remind ourselves that “past indicators are not predictors of future events.”
So let’s focus on what we know. We still don’t know what list of drugs CMS will target for price negotiations, but we can know (or reasonably find out from the Federal Reserve) what inflation has been like since 2011. It is therefore possible for us to start to contextualize what a Medicare inflationary rebate might look like.
First, let’s look at the aggregate Medicare data from Figure 3. It isn’t too hard for us to add an annual Consumer Price Index (CPI) line to that data and get an idea of how the overall drug market might be impacted by a Medicare inflationary rebate (Figure 4). To be more specific, we’re relying upon the Consumer Price Index table from the Federal Reserve Bank of Minneapolis to add the inflation line to Figure 4.

Figure 4
Source: Elsevier Gold Standard Drug Database, Federal Reserve Bank of Minneapolis, 46brooklyn Research
What we see in Figure 4 is perhaps the rationale for an inflationary rebate policy. Over the years, the list price behavior of brand medications have, in the aggregate, consistently been higher than the annualized rate of inflation. As a result, brand drug list prices increasingly seem unaffordable relative to our purchasing power. If, say, you’re getting a raise every year that keeps pace with the rate of inflation, then the list prices of these brand products are consistently getting more expensive for you year-over-year (as their price is increasing faster than said inflation). If you’re not following what we mean, take a look at Figure 5. Here, we assume we’re making $15 per hour in the year 2010, and looking to afford a $15 brand name medication over the years of 2011 to 2022 (we know no brand was really $15 in 2011, we just want the number to be the same to show how divergent growth was over time). We’re going to assume that our pay got increased by the CPI every year and the brand name medication got more expensive based upon the Median values in Figure 4. As we can see, under this paradigm, the brand medication got less and less affordable each year (except for 2022).

Figure 5
Source: Elsevier Gold Standard Drug Database, Federal Reserve Bank of Minneapolis, 46brooklyn Research
That said, there are two big caveats to this narrative. First, and foremost, we again know that there are massive discounts that exist and that the rebate activity of these drugs is reducing the real net cost of these medications significantly (and maybe resulting in prices below the rate of inflation on a net basis; results will vary depending on the drug). Second, regardless of the unknown rebates (which we’ve already complained about), 2022 broke the mold. In the aggregate, brand drug price increases did not keep up with inflation (blue slope greater than orange slope in Figure 5). As a result, drug manufacturers effectively took a price decrease on a list price basis alone (rebates be damned).
Now, it’s hard to give them too much praise for these list price feats given the previous decade’s worth of past experience, but it is true that last year, even without considering what happened with rebates, brand drugs more or less got cheaper (especially in comparison to other things we might buy in the aggregate). And while these aggregate views are semi-helpful to understanding why policy moved the direction it did, we wanted to dive in a little deeper into the back end of our dashboard and track the percentage of list price increases for products each year that were above the annual CPI. We wanted to see, outside of the aggregate, which products actually mattered (even over the last year with its higher than usual CPI). Figure 6 tracks the number of brand products whose list price changes in a year were higher than the CPI-U average of that year.

Figure 6
Source: Elsevier Gold Standard Drug Database, Federal Reserve Bank of Minneapolis, 46brooklyn Research
As can be seen in Figure 6, with the increase in the rate of inflation the last two years, the number of products whose price increases are exceeding the CPI threshold are coming down (pretty dramatically in 2022, but unsurprising given the overall inflation). Of course, we can also note that in every year, there are exceptions. Meaning, that even in the historic years of list price behavior much higher than inflation, there were drugs that did not increase at that pace. Similarly, in the last year of very high inflation, there were a few products whose prices on a list basis were even higher than overall inflation. The most impactful 2022 products whose list price behavior was still higher than inflation, in our estimation (based upon Medicaid expenditures) are the following:
Humira - Q1 price increase 14.8% - prior year gross Medicaid expenditures (PYME) $7.1 billion
Enbrel - Q1 price increase 7.4%; Q3 price increase 2.4% (SureClick) - PYME $578 million
Q1 price increase 14.8%; Q3 price increase 4.8% (Solution) - PYME $256 million
Cosentyx - Q1 price increase 7%; Q3 price increase 2% - PYME $554 million
Norditropin - Q1 price increase 9.5% - PYME $972 million
Otezla - Q1 price increase 14.8%; Q3 price increase 4.8% - PYME $362 million
Gilenya - Q1 price increase 10%; Q3 price increase 4.08% - PYME $327 million
Entresto - Q1 price increase 7%; Q3 price increase 2% - PYME $262 million
Uptravi - Q1 price increase 5.4%; Q3 price increase 4.3% - PYME $148 million
Promacta - Q1 price increase 7%; Q3 price increase 2% - PYME $146 million
Sabril - Q1 price increase 6%; Q3 price increase 3.5% - PYME $144 million
We generated this list based upon the products whose gross Medicaid drug spending in 2021 was the highest (on the subset of drugs whose list price increases in 2022 were higher than CPI). In total, these 10 products accounted for roughly 15% of Medicaid gross expenditures (just over $11 billion). These products are some of the poster children of drug pricing conversations over the last decade. A quick Google search of any of these products will yield some stories discussing their affordability. Who knows how that will change with the IRA, but it’s safe to say there is $50 million in list price value for these drugs above the CPI price threshold (meaning that if these products were limited to just CPI with their price increases, their list prices into the new year would be $50 million less than they’re assumed to be, assuming utilization remains unchanged).
Therein lies the rub.
As previously mentioned, Medicaid has had inflationary rebates since 1993 (that is a long time in the drug pricing world). What that means is that over the last three decades, Medicaid has more or less been protected from the price behavior of the larger market. As brand products took price increases, those products actually got more affordable in Medicaid. In fact, Medicaid and CHIP Payment and Access Commission (MACPAC) recently talked about just how effective inflationary rebates have been for Medicaid. In MACPAC’s October 2022 presentation titled “Trends in Medicaid Drug Spending and Rebates,” the organization identified that 50.5% of branded drugs in Medicaid had an inflationary rebate, accounting for 62.2% of brand utilization and a whopping 76.3% of brand spending (Figure 6). Furthermore, the Inflationary Rebate accounted for 23.3% of the brand rebate reduction (The basic MDRP rebate was 38.3%, for a total rebate of 61.6%; note that for drugs that reach the rebate cap, MACPAC applied the full amount of the basic rebate before calculating the inflationary rebate as the total rebate minus the basic rebate.).

Figure 6
Source: MACPAC
At the risk of spending too much time talking about this, we should appreciate that Medicaid doesn’t directly negotiate for their rebates. Rather, their rebates are determined via a formula. That formula can, on its surface make a drug beyond free for Medicaid. Meaning, that if the drug’s best price and inflationary rebate align the right way, Medicaid can actually get paid for dispensing drugs (i.e., they spend $100 on a claim and get $150 back in rebates). However, for the last many years, there has been a cap in place which says that if the math gets to the point where the drug is beyond free, the best it can ever get is $0. Well, coming into the new year, that cap is going away (more change to factor into the equation in the New Year).
We spend time laying all of this out, not because it’s academically interesting, but because we need all of this background information to get a handle on where the incentives lay in this system. When you’re a program with inflationary rebates, like Medicaid, the last decade of pricing behavior can be good for you. Approximately half of your rebate value can be attributed to this inflationary rebate component of your rebate formula. Meaning, the first-of-the-year news stories on brand price increases being high can actually be music to your years (so long as inflation is low). Pretty weird, huh? When the pricing behavior last year (2022) for many products didn’t keep up with CPI, Medicaid can actually experience potential net cost growth. And while not solely attributed to this phenomenon, as you can see in Figure 7, the net cost growth is something MACPAC observed for Medicaid (despite getting the best price and inflationary rebates).
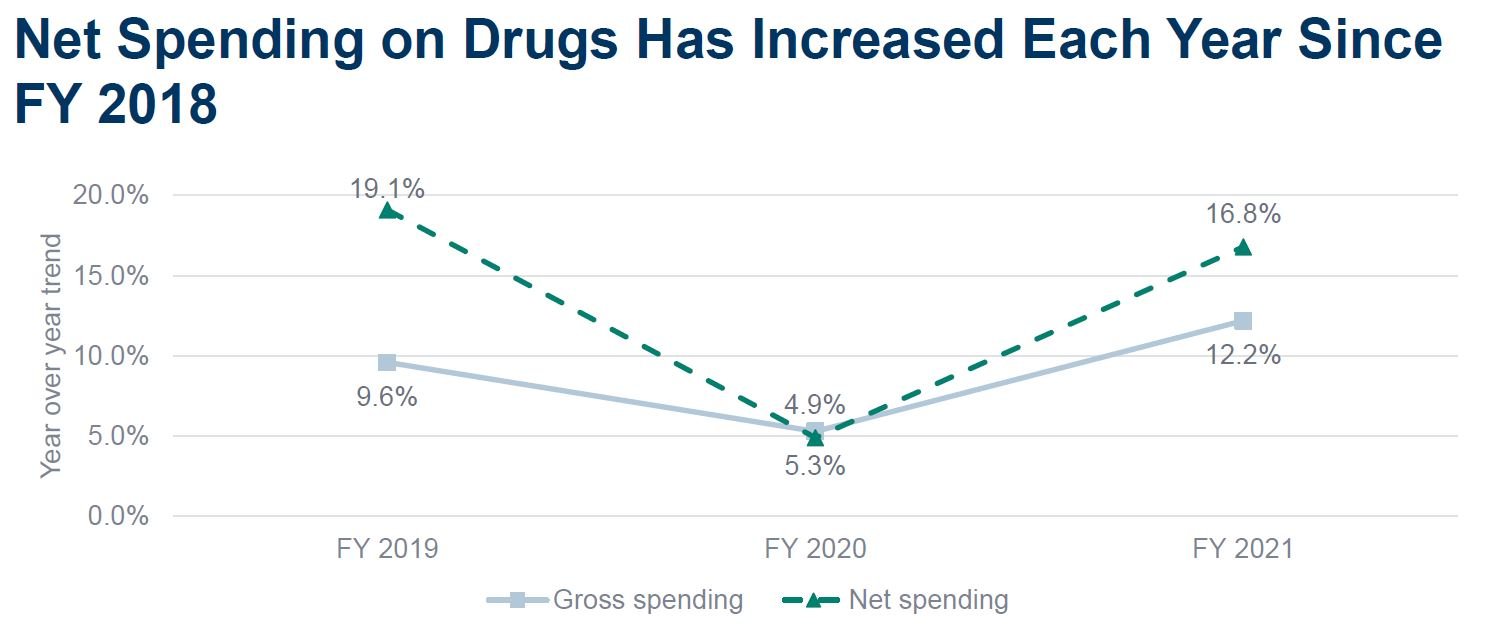
Figure 7
Source: MACPAC
So given that Medicaid rosters swelled during COVID (reasonably so), and those extra people haven’t necessarily come off the rosters yet (see Texas’ efforts to unwind sooner then later), Medicaid’s net cost behavior over the last year per member may have been higher than expected. Which can have big impacts to state budgets across the country, who haven’t had to grapple with this dynamic of drug’s losing ground on inflation for quite some time. Time will tell how this all plays out, but it is certainly a very interesting time to be in the drug pricing space. And of course we mention all of this because if the strategy employed by drug manufacturers into the new year extends into future years (and list price increases don’t keep up with inflation), well then Medicare may not get much value out of the inflationary rebate (despite all the value Medicaid got historically).
The kick is up … and it’s wide left
Thank you for joining us in our annual ritual to check in on first of the year drug price changes. As in years past, we see the story of list price growth year-over-year. For some, that will be enough of a narrative to end our tale. For us, we think we should pause and appreciate again that for the first time since we’ve been doing these reports, the list price growth in the aggregate over the last year was below the rate of inflation. This means that, all else being equal, these products are actually more affordable than other products we might buy year-over-year. Now, that is a very narrow view of the world, because these products also have been racking up list price increases over the last decade that one year of breaking the mold cannot overcome. However, we’re entering a brave new world where CMS will engage in drug pricing negotiation and have its own rebate program soon. As folks react to this new world, we’ll likely see a bunch of different strategies employed by manufacturers to try and address the changes. And certainly those changes will have knock-on effects outside of Medicare (everyone wave at commercial plan sponsors – What does your strategy look like in 2023? The status quo? Are you sure?).
If nothing else, our New Years resolution will be to try and increase the appreciation for just how disparate the market actually is. Just because the aggregate story tells one narrative, individual results may vary end up varying significantly. And that disparity in drug pricing, arguably more so than any other aspect, is what we see as the real challenge in contextualizing drug prices. When there are a dozen different prices for a thing, there are effectively no prices for that thing. And when you have a non-normalized sample you’re attempting to act on, results can certainly be mixed and nearly impossible to replicate. Many industries look to standardize results before looking to make improvements. If you’re producing a machine that kicks game winning 50-yard field goals, and that machine misses half of the time, you’re probably better served trying to make you’re machine more consistent at 50-yards than trying to make the same machine start hitting 60-yard field goals.
A lot of our nation’s drug pricing efforts have been directed towards the latter in our estimation. Ensuring that someone is the guaranteed best payer, means that everyone else is worse (to varying degrees). Ultimately, that effects of that inequity compounds through the market with patients, employers, and providers often left holding the bag.
Thanks to Michael Erman and Julie Steenhuysen at Reuters, Hanzi Chen and Katabella Roberts at NTD News, Jonathan Gardner at Biopharma Dive, Fraiser Kansteiner at Fierce Pharma, Christine Blank at Formulary Watch, and Zachary Brennan at Endpoints News for all digging into the new year price increases on our dashboard and chatting with us on the early takeaways.
