
What’s happening to generic drug prices? March 2019 NADAC Survey Update
It’s that time of the month again: NADAC survey results week. There was a lot of movement on drug prices last week, so be sure to click through our new updated visualizations (NADAC Change Packed Bubble Chart and Drug Pricing Dashboard) to see the impact.
As a reminder, each month retail pharmacies across the country are surveyed by Myers Stauffer (on behalf of the Centers for Medicare and Medicaid Services) on their wholesaler invoice prices. The results are then compiled and released either the third or fourth week of the following month. Last week, survey results were released that reflect National Average Drug Acquisition Cost (NADAC) price changes from February. Here are our top takeaways on the results:
1. On the surface, March 2019 looks deceptively similar to February
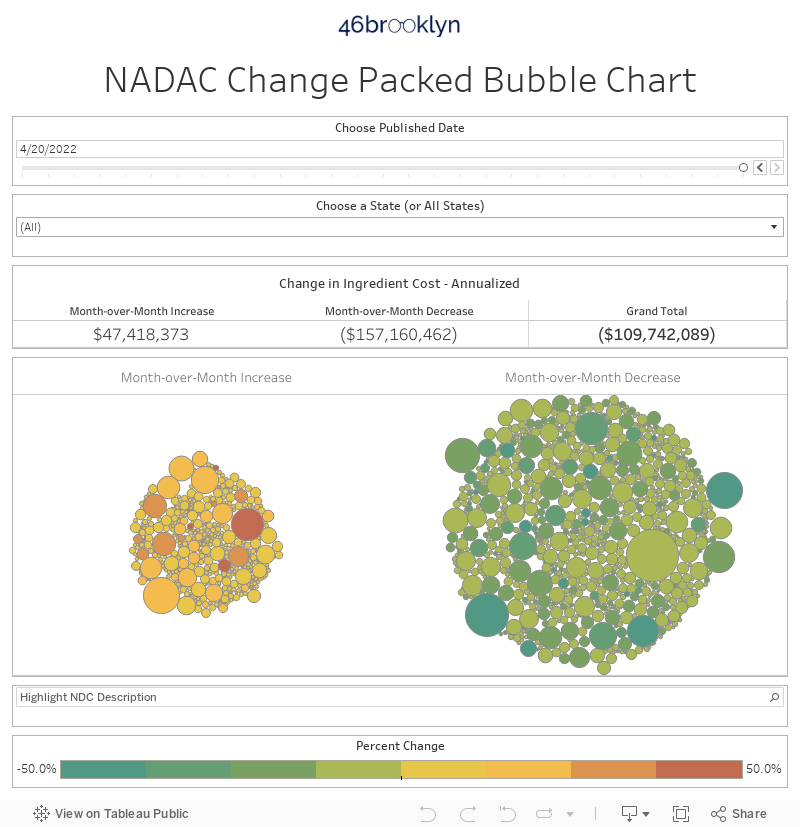
Each month, we first look at how many generic drugs went up and down in the latest month’s survey of retail pharmacy acquisition cost, and compare that to the prior month. Recall, last month (February) we saw some meaningful generic price inflation. As shown in Figure 1, before weighting the changes in generic drug costs, March changes look very similar to those in February.
Figure 1
Source: Data.Medicaid.gov, 46brooklyn Research
In March, for every generic drug that experienced a price decline, there were 1.05 generic drugs that experienced a price increase. That’s slightly down from a ratio of 1.13 in February. In March, there were 4% more generic drugs that experienced a 0-10% price decrease, and 3% more generic drugs that experienced a price decrease of more than 10%. Interestingly, there were also 3% more drugs that experienced a 0-10% price increase, but 20% fewer drugs that experienced a price increase of more than 10%. Overall though, the two months look quite similar to one and other.
2. March data shows us the importance of weighting generic drug price changes! March swings to $75 million net deflation.
As we’ve written in prior updates, knowing the price change alone is not enough. We need to apply utilization to the price changes, which is the purpose of the NADAC Change Packed Bubble Chart. We use Medicaid’s first three quarters of 2018 drug mix and annualize it to arrive at an estimate of the total dollar impact of the latest NADAC pricing update.
This weighting exercise was especially important in March. As we illustrated in the prior section, more generic drugs increased in price than decreased in March. However, after applying all of the price changes to Medicaid’s utilization, we arrive at annualized generic deflation of $75 million.
We find it fascinating that the unweighted drug price changes in February and March were very similar, but when we weight the two months (again, using Medicaid’s utilization) we get such different results. February had $75 million in inflation. March had $75 million in deflation (you can flip between the two months in the viz embedded below). This is a great reminder to all drug pricing reporters and researchers to be very careful with analysis of unweighted price changes. While interesting, without the proper context, they can be quite misleading.
3. The power of competition is driving generic Tamiflu prices down
If you check out our Drug Pricing (NADAC) Dashboard, you’ll see that generic Tamiflu (Oseltamivir Phosphate) has been moving downwards over the last two years. Below, Figure 2 shows the price trend of the Oseltamivir Phosphate 75 mg Capsule.
Figure 2
Source: Data.Medicaid.gov, 46brooklyn Research
As you can see, in between August 2018 and November 2018, there was a brief bounce, which we highlighted in both in our September 2018 and October 2018 NADAC reports. The important thing to note here is that when you view each month’s NADAC Change Packed Bubble Chart, the snapshot that a month or two provides is valuable, but not necessarily a reflection of an overall trend.
In the case of Oseltamivir Phosphate 75 mg Capsule, while October 2018 showed a big jump in price, overall, the price has shown a downtrend over time. This occurred in large part due to an increase in competition. If you hover over the line on our Drug Pricing Dashboard, you’ll see that at the end of 2017, there were only three drug labelers selling Oseltamivir Phosphate, but today, that number has tripled to nine labelers. This past month, the NADAC took another big tumble – a decline of $1 per capsule. The increased competition over time has resulted in a price that has been cut by more than half over the last two years.
4. Generic Viread takes another price cut, but will high markup states ever see the savings?
Before we launched 46brooklyn, one of the more interesting drugs we tracked was generic Viread (Tenofovir Disoproxil Fumarate 300 mg Tablet), which helps treat HIV and hepatitis B. HIV/AIDS medication prices have historically been a major source of controversy.
If you check out our Brand Drug Price Change Box Score or Figure 3 below, you can see that Gilead Sciences has registered annual list price increases of Viread around 6.9%. While these increases may not necessarily reflect any rebates or other pricing concessions that may make net costs lower, regardless, these increases have had patients and activists fuming.
Figure 3
Source: Data.Medicaid.gov, 46brooklyn Research
What’s cool about our Drug Pricing (NADAC) Dashboard is that once you select the generic drug you want to examine, the brand name version can be selected as well, which gives you the ability to track both brand and generic versions of the same drug on the same chart. See Figure 4 to see both Viread and its generic, Tenofovir Disoproxil Fumarate, tracked simultaneously.
Figure 4
Source: Data.Medicaid.gov, 46brooklyn Research
As you can see, the 6.9% increases on the brand version occur like clockwork. And despite it looking as if 2019 might see a reprieve on the annual increases, last week, we learned that the prices on a number of Gilead drugs are going up, including Viread.
While we wait for the new increase to register on CMS’ NADAC pricing file, for now, we can see that in the span of about five years, the price of Viread increased around $10 per tablet. While there is ongoing scrutiny of Gilead’s strategies in the HIV space, this year’s increase is important to chase with a shot of context.
In Figure 4, you see that in early-2018, the generic version of Viread was released. Teva and Strides Shasun sprinted right out of the gate and immediately starting driving savings. By the end of March, the generic release had already eradicated more than five years worth of Viread increases. In April, the price did the Zumanjaro Drop of Doom, falling more than $20 per tablet! This probably had something to do with the fact that by Q2 2018 there were already six different drug labelers competing to sell this drug into the marketplace (Figure 5).
Figure 5
Source: Data.Medicaid.gov, FDA.gov, 46brooklyn Research
Despite all the fervor over the previous price increases and all the negative headlines, the generic marketplace is absolutely pummeling the price of Tenofovir Disoproxil Fumarate, and not a peep about it beyond the Gilead Q1 2018 earnings report that showed their sales of branded Viread dropping $110 million from the same time the previous year.
This NADAC update was yet another decrease in a long line of decreases for generic Viread – this time declining 26.8% from last month. Surely, groups like the AIDS Healthcare Foundation, who have been bemoaning the 6.9% annual increases should be jumping for joy now that this drug has gone from over $36 per tablet to nearly $1 per tablet in just about a year’s time.
But maybe the reason groups like the AIDS Healthcare Foundation haven’t covered the drop is the possibility that they haven’t been exposed to the decreased costs. If you check out our Top 20 Over $20 chart below in Figure 6, you’ll see that Tenofovir Disoproxil Fumarate 300 mg Tablet is one of the 20 drugs with the highest “markups” in the country. Below is a snapshot of Q1, Q2, and Q3 2018 Medicaid managed care programs nationwide. Fifth from the bottom is Tenofovir, registering markups of more than $187.63 per prescription over that time period.
Figure 6
Source: Data.Medicaid.gov, 46brooklyn Research
To see the markups in action, you can check out our Medicaid Drug Pricing Heat Map or take a look at Nevada Medicaid managed care pricing on this drug versus NADAC through the first three quarters of 2018 (below). Ouch. 🤦♂️
Tenofovir Disoproxil Fumarate 300 MG Tablet Nevada Managed Care Cost per Unit
We walk you through these shameless plugs for our dashboards to show you the different uses for our various tools, but to also show you that despite some drug prices actually dropping, the price that gets paid in the market gets dictated by the supply chain, and those prices may not necessarily be based on actual costs.
5. Generic Suboxone prices maintain gradual decline, with massive Medicaid savings
For better or worse, one of the most commonly dispensed medications to Medicaid beneficiaries is generic Suboxone (Buprenorphine-Naloxone SL Tablet). America’s opioid epidemic continues to fester, and it should come as no surprise that as a result, we are paying for a lot of medication-assisted treatment to curb addiction.
In our NADAC Change Packed Bubble Chart, if you type in “Buprenorphine-Naloxone,” both strengths appear as Month-Over-Month Decreases. Hover over each of those bubbles (Figure 7 shows what it should look like), and you can see just how impactful even the slightest movement on price can be for state Medicaid budgets.
Figure 7
Source: Data.Medicaid.gov, 46brooklyn Research
The NADAC for Buprenorphine-Naloxone 2-0.5 mg SL Tablet declined 20.2% last month, which for more than 70,000 prescriptions, it created more than $700,000 in annualized savings for state Medicaid programs. However, just so you can see how much utilization trends matter, Buprenorphine-Naloxone 8-2 mg SL Tablet declined just 2% –$0.04 per unit – but because of much, much higher dispensing rates, the annualized impact was more than $7 million.
6. OK, let’s talk about generic Nizoral
One of the drugs that experienced the highest jumps last month was generic Nizoral (Ketoconazole 200 mg Tablet), registering an increase of more than 80%. An old generic registering a sudden increase that high has to be a story, right? Some greedy generic company most have thought they could sneak one past the goalie, right? Well, according to Figure 8, it turns out …
Figure 8
Source: Data.Medicaid.gov, 46brooklyn Research
… we have no clue what is going on.
First of all, back in 2014 Ketoconazole Tablets were $0.20 per tablet. Then suddenly, in June 2014, the price took a three-month journey northward, spiking 775% to $1.55 per tablet. This massive hike earned Ketoconazole a not-so-coveted spot on the Government Accountability Office (GAO)’s “Established Generic Drugs under Medicare Part D That Experienced Extraordinary Price Increases” list.
We have scoured the web looking for answers but can find no coverage or news highlighting the reason for this spike. If any of readers can point us to anything explaining this massive spike, let us know.
As you can see from Figure 8, the price of Ketoconazole Tablets has been bouncing up and down like a basketball ever since the 2014 spike, and it has never recovered. While this month’s price increase is large and noteworthy, it seems to be just the latest in a long series of dips and spikes.
Note: Downloading the 46brooklyn data
We’ve received several requests on how to get the data that lives behind our visualizations, especially this one. Keep in mind that with all of our dashboards, if you go to each one’s individual Visualization page, you can find links to all of our publicly-available data sources so you can use them for your own purposes.
To download the specific data that lives behind our bubble chart, first click in the white space within the bubble chart, as shown in Figure 9.
Figure 9
Source: 46brooklyn Research
Next, click on the download icon at the bottom left of the visualization, as shown in Figure 10.
Figure 10
Source: 46brooklyn Research
A download popup should appear on your screen. Click the “data” option within the box, as shown in Figure 11.
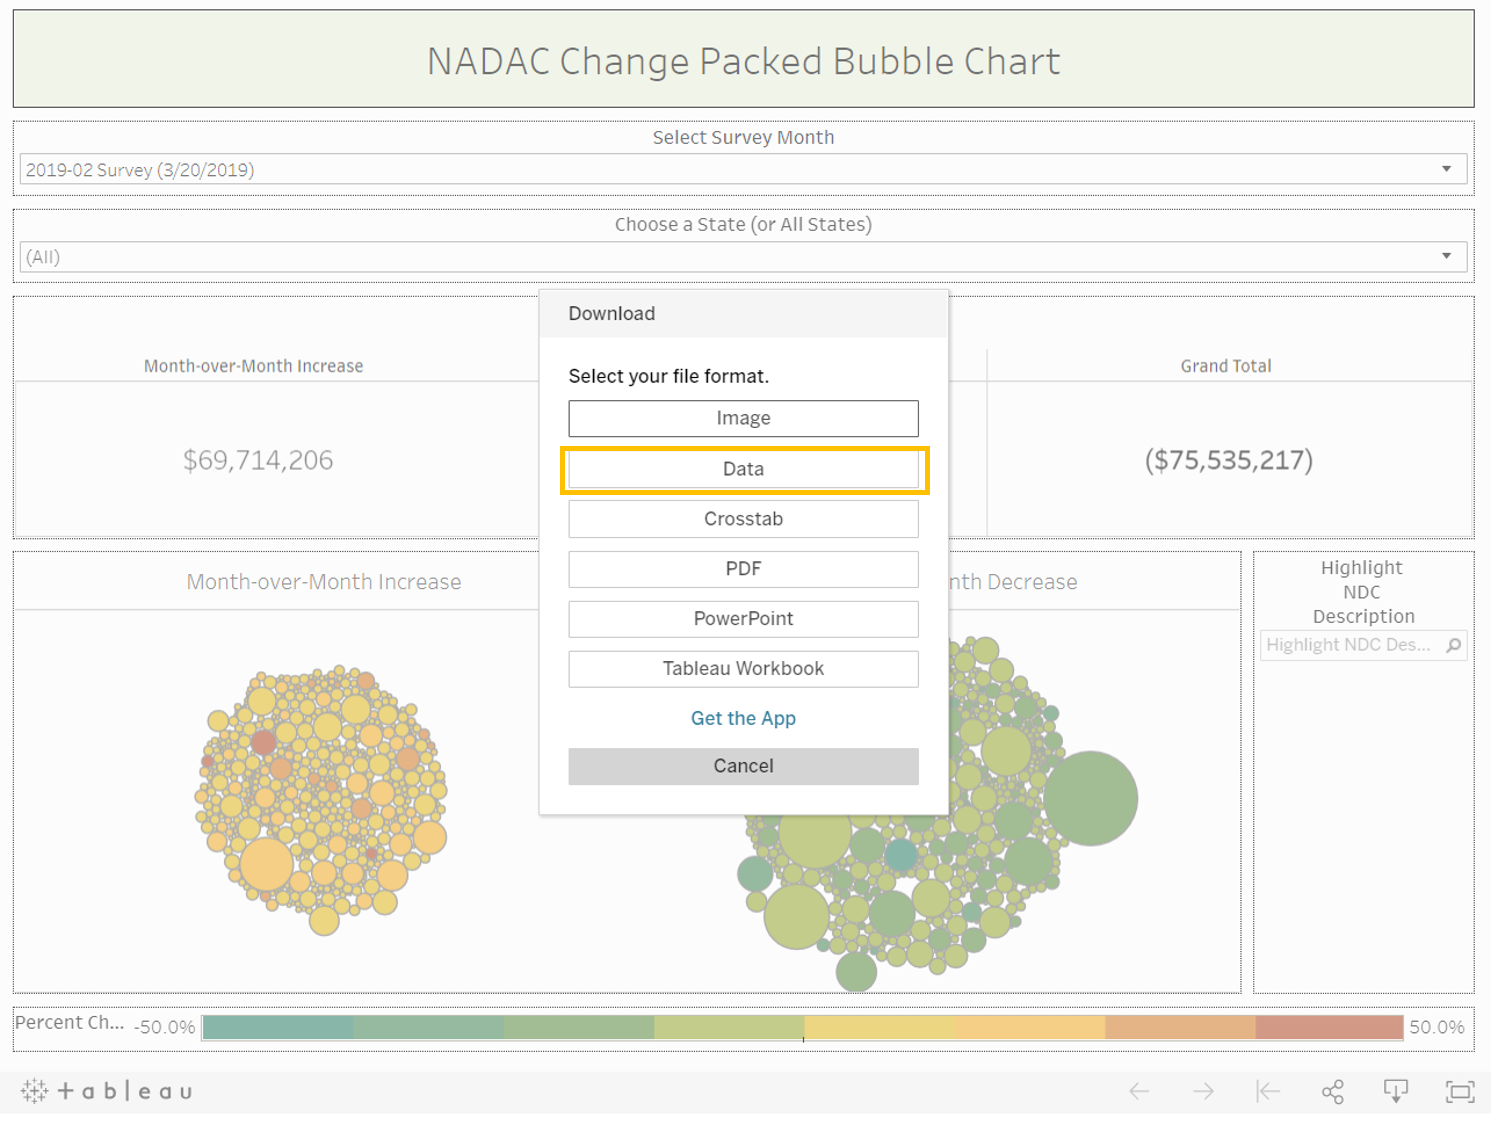
Figure 11
Source: 46brooklyn Research
Note: if the “data” option is greyed out, try to click on the whitespace in the bubble chart again. Tableau will only let you download data from a worksheet that contains data behind the scenes – so you must select such a worksheet to activate this data download option (this applies to all of our visualizations by the way).
Another window will then pop up with the data, which should look something like Figure 12. The window will default to a “Summary” view, which is simply a table including all of the data you see on the bubble chart. If you want all of the data that lives behind this chart (which includes mix for all 50 states) select the “Full data” tab. You can download either by clicking on “Download all rows as a text file.” Figure 12 has orange stars next to each of the tabs or links you’ll need to navigate and download the data.
Figure 12
Source: 46brooklyn Research
You should be able to use this process to download the underlying data from any of our visualizations. If you are having any problems with this, please don’t hesitate to contact us.
What are you seeing?
While we spend more time than we’d like to admit studying the pricing changes during each NADAC Survey Results Week, we don’t always catch every story worth noting. Be sure to take a gander at all of our updated Visualizations that rely on NADAC prices. If you’re seeing any interesting movement on drugs in the dataset, let us know.
Our first webinar!
Last week, we were honored to participate in a special webinar for the Council of Insurance Agent & Brokers (CIAB), where we worked to educate members of CIAB about the work of 46brooklyn and ways that payers can use our free tools to get a better handle on how prescription drugs are being priced in the market. If you’ve ever wanted a run-through of who we are, why we launched 46brooklyn, and how to use our website, check out this brief webinar from the great folks at CIAB.
As goes Ohio, so goes the nation?
Last week, Kentucky’s Attorney General Andy Beshear launched an investigation into “inflated” prescription drug prices. Specifically referencing the recent news and findings out of Ohio, Beshear is aiming to pull back the curtain on the state’s Medicaid drug spending. 46brooklyn co-founder Antonio Ciaccia, who has been living and breathing the Ohio story, spoke with the Louisville Courier Journal about the announcement and controversy brewing in Kentucky.