
Examining 2021's brand drug price increases and sneaking a peak at the early price hikes of 2022
Happy New Year!
The start of a new calendar year traditionally offers us all a time to reflect on the past year, as well as contemplate the year to come. Often, this contemplation takes the form of a resolution for the New Year – which if survey’s can be believed, last a little over a month before they are abandoned.
Those of us at 46brooklyn see no reason why drug pricing research can’t follow these traditions (**fingers crossed we keep our resolution at being more concise in our publications this year**). Last year, we undertook great efforts to change the way that brand drug list price increases are monitored, tracked, and reported. Those efforts were largely successful, as arguably never before was such transparency into brand drug pricing (as tracked by wholesale acquisition cost, or WAC) behavior available to the public.
So we thought we would kick off this year by reflecting on what brand price increases taught us last year, as well as giving a first look at the drugs taking price increases here at the start of the 2022.
We’ll try to keep this brief 😄
(**Feel free to explore the newly updated 46brooklyn Brand Drug List Price Change Box Score dashboard for yourself if you don’t want us to potentially bias your review)
A Review of Brand Pricing in 2021
The year 2021 was a stand-out in terms of the number of brand drug list price increases relative to the last few years. The importance of the emphasis in the prior statement likely cannot be understated. By the numbers, the year 2021 reversed what had been a decade’s long tradition of fewer and fewer brand products taking list price increases.
Specifically, at the final count there were 1,260 brand list price increases in 2021. That number exceeds the amount of brand price increases in both 2020 (1,060) and 2019 (1,164) and was just 45 shy of tying the amount of brand increases taken in 2018 (1,305). Figure 1 below shows this trend:
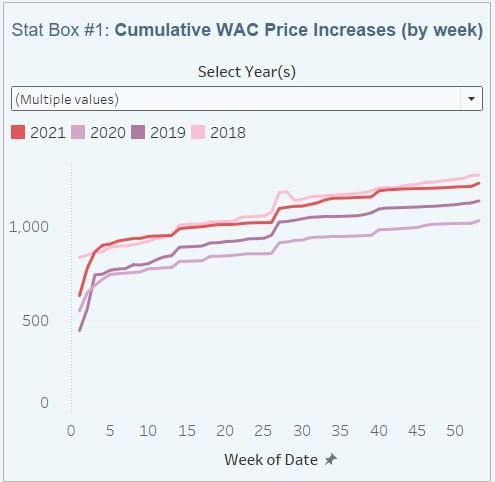
Figure 1: Source: 46brooklyn Research, derived from Elsevier Gold Standard Drug Database (GSDD)
Of course, the median price increase for all these products in 2021 (4.8%) was lower than any of the prior years over the last decade (previous low was 5%, in both 2020 and 2019). This trend can be seen in Figure 2 below:
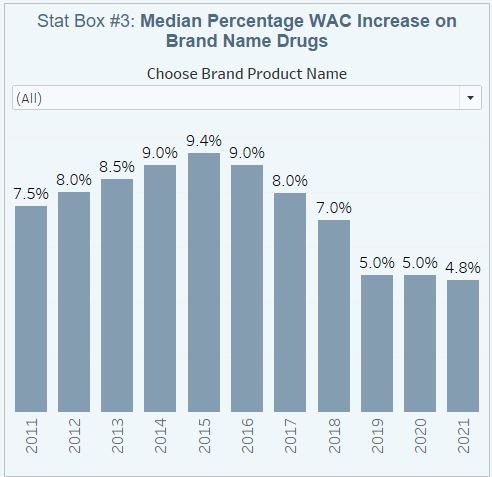
Figure 2: Source: 46brooklyn Research, derived from Elsevier Gold Standard Drug Database (GSDD)
But the amount of spending in Medicaid programs impacted by brand products taking a price increase was higher in 2021 than in any of the prior three years (72% of Medicaid spend impacted by brands taking a WAC price increase in 2021 compared to 69% in 2020, 68% in 2019, and 69% in 2018; Figure 3 below).

Figure 3: Source: 46brooklyn Research, derived from Elsevier Gold Standard Drug Database (GSDD)
Furthermore, the average pre-rebate cost for a brand product with a WAC price increase was never higher than in 2021 (at $955 per prescription based upon Medicaid claim utilization; 25% increase from 2020 as per Figure 4 below).
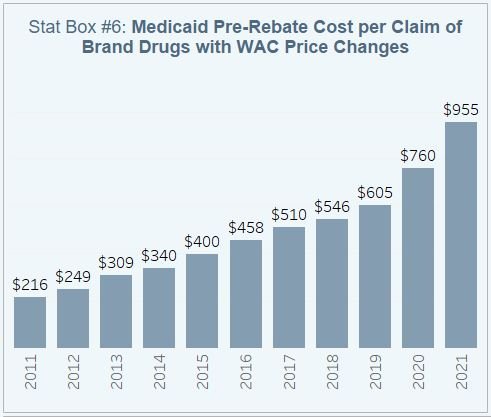
Figure 4: Source: 46brooklyn Research, derived from Elsevier Gold Standard Drug Database (GSDD)
It’s important to acknowledge that these are list price trends, and they do not account for what’s happening below the surface, where big rebates and discounts and drugmakers can distort the reality of what’s happening with the net prices of those drugs, which by some measures have shown some downward trends. Of course, we don’t have a data set (public or private) to share insights into those rebates so we’re doing the best with what we got.
Welcoming 2022 price increases to the drug pricing party
At the start of 2022, we see a net of 456 brand products have taken a WAC price increase at the start of the year. As of January 2 (our data was current as of 1/1/2022), old favorites have already shown up to the drug price increase party. Drugs like Latuda, Vimpat, Keytruda, and Biktarvy (just to mention a few) have taken 2022 year price increases (after having done so previously 2021). Additionally, the median price increase for the drugs, and some anecdotes thus far in 2022, suggest slightly higher price increases behavior than in 2021. In fact, if we limit our view of 2022 price increases to those with the highest utilization in Medicaid, we can see that the degree of price increase is relatively greater than the 2021 behavior; see Figure 5 below.
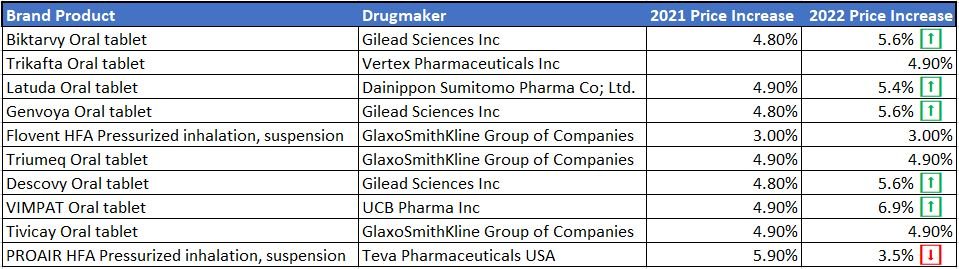
Figure 5:
Source: 46brooklyn Research, derived from Elsevier Gold Standard Drug Database (GSDD)
It is also worth noting that you will find Biogen’s much-publicized slashing of the price of Aduhelm reflected in the Box Score as well.
Of course, it is far to early to know how this trend will play out of 2021. However, this observation can help us explain what we observed in Figure 5 above. If the same price increase is taken in 2022 as was taken in 2021 (i.e., 4.9% in both years for GlaxoSmithKline’s Triumeq), the total dollars of the 2022 price increase will be higher in 2022 than in 2021 (as it is taken off of the larger 2021 number). This is of course amplified when the price behavior is higher than in prior year (i.e., 5.6% price increase in 2022 for Gilead’s Biktarvy compared to a 4.8% increase in 2021). Right now, the drugs taking list price increases at the start of 2022 are trending towards a higher degree than last year (but its far, far to early to say whether this trend will continue. We will check back periodically to monitor progress).
Welcome to 2022
At the end of the day, context and methodology remain incredibly important when having discussion around brand drug list prices. On the surface, 2021 might seem like a problematic year given the number of drugs that took price increases. But those price increases were relatively small, as measured by percentages, compared to prior years, which strikes us as particularly noteworthy given (i) the numbers don’t reflect the rebates the drugs are likely offering; and (ii) the fact that many other markets were/are experiencing inflationary pressures to a greater degree than at any point over the last decade. And stepping a little further into the numbers, we can see that even though the percentage of price increase behavior was smaller than at any time over the last decade (4.8% for the products we are discussing), the average brand price has never been higher in terms of dollars (thanks to our friend compounding interest).
So as we reflect on what 2021 taught us in regards to drug pricing, we know that we still have a long way to go in monitoring and discussing these price trends. However, we do know that an overt focus on brand price increases can miss a lot of the important nuance that goes on in the drug supply chain.
With that, we invite you to continue to follow along in 2022, where we will continue to update our Brand Drug List Price Change Box Score at a minimum of once per week in January and at a minimum of once per month throughout the year. You can check the tool on your own, or you can subscribe below in order to receive our monthly drug pricing reports and other research works and commentary throughout the year.
Shout-out to Elsevier for allowing us to use their Gold Standard Drug Database (GSDD) to provide these pricing insights, and to Arnold Ventures for supporting our visualization building and data analytics work. As a reminder, if you want more details on how to better understand the Box Score, be sure to review the companion report that we released last year in conjunction with the tool.
Thanks to Darrel Rowland at the Columbus Dispatch for chatting with us and including our praise of the Ohio Department of Medicaid’s recent announcement of an inquiry and investigation into new pharmacy benefit manager (PBM) maneuverers to collect pricing spreads and inflate the costs of medicines within the program, years after the Dispatch’s own reporting helped the state uncover hundreds of millions of dollars in hidden PBM upcharges.