Inside AWP: The arbitrary pricing benchmark used to pay for prescription drugs

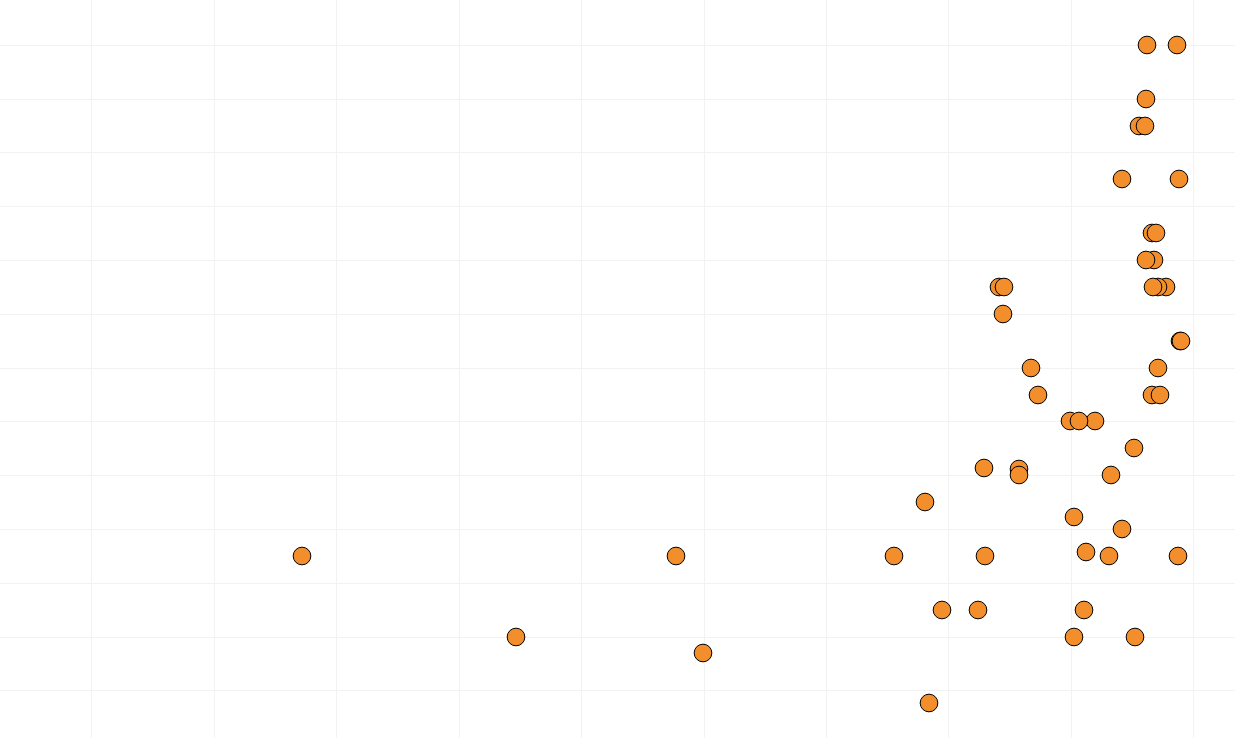
Average Wholesale Price (AWP) is a meaningless benchmark price for generic drugs.  This has been known for at least a decade, if not longer.  But despite its lack of substance, AWP-based payment models just won't go away.  Unfortunately the contractual reliance on a benchmark that has no relevance to actual price makes it very difficult for the payer to know if they are getting a good deal or not.  They are left to pay a fixed discount off of an unknown combination of meaningless, non-market-based, numbers. Seems like that would be tough sell, but this is drug pricing we are talking about, so of course, it's the norm. For the past couple months, we compiled data to create a visualization to help illustrate the problem that arises by anchoring generic drug costs to AWP.  The finished product is embedded in this latest report "Inside AWP: The Arbitrary Pricing Benchmark Used to Pay for Prescription Drugs," along with our observations and analysis.

Read More
Ben LinkAWP, PBM, NADAC, WAC, Amlodipine
Examining high drug markups: Introducing the Top 20 over $20

We’re told that drug prices are too high, but who actually is setting the price and where does the money end up going? CMS recently updated their State Utilization databases, which track what state Medicaid programs are being charged for prescription drugs. Most notably, they extended the 2018 data to include the second quarter. We have updated our datasets and visualizations to track the changes in drug markups relative to their actual costs. We’ve studied up and have come up with our “Top 20 over $20” list. In other words, the top 20 drugs dispensed through Medicaid managed care organizations (MCOs) with a markup in of over $20 per prescription. Think of it as a “top 40 under 40” list for generic drugs, with the main difference being that no self-respecting generic drug wants to be on this list. Check out our new visualization that highlights the drugs that are busting the budgets of state Medicaid programs.

Read More
Inside the wild universe of prescription drug markups

Over the past couple weeks, we’ve been reflecting more on how neat Bloomberg’s Ohio Medicaid markup bubble chart was in their recent article, “The Secret Drug Pricing System Middlemen use to Rake in Millions.” We’re kicking ourselves now that we neglected to delve deeper into this in our report, “Bloomberg Puts Drug Pricing ‘Markups’ on the Map”. But like fine wine, good visualizations only get better with time, so it took us a few weeks to fully realize the possibilities that such data analysis could open up. Bloomberg’s excellent visualization does, however, leave a few open questions. What do other state Medicaid managed care programs look like? How do they compare to state fee-for-service programs?  What do all states look like? To answer these questions, we set out to build a new visualization dashboard to compare drug markups between state Medicaid programs. We call our creation the “Medicaid Markup Universe” (because it looks very celestial). In this new visualization tool, we found a disturbingly large difference in drug markups across generic drugs in state Medicaid managed care programs, resulting in a slew of warped incentives that pressure supply chain members to value certain medications over others, and thus, certain patients over others.

Read More
Bloomberg puts drug price “markups” on the map

Earlier this week, Bloomberg reporters published their results of a fascinating deep dive into Medicaid generic drug prices. The piece did an excellent job explaining the ins and outs of the hidden pricing spreads that exist on generic drugs, and it featured some intuitive visualizations that helped educate readers who may not have been familiar with these little-known drug price tactics. The analysis conducted by Bloomberg also integrated the results of a recent report from the state of Ohio's Auditor, which found that in a one-year span, PBMs pocketed more than $224 million dollars in spread pricing. Armed with this data, we set out to discover if we could deduce what pharmacy margins were over that same time period in an effort to peel back new layers of the onion and provide better information on where the money is going. Check out our newest drug pricing report to learn more about hidden prescription drug markups.

Read More
Analyzing HHS’ 100 Days of Action report

In August, the U.S. Department of Health & Human Services (HHS) released a special report highlighting the Trump administration’s progress on lowering drug prices for Americans. The HHS report, which focused on the first 100 days since the administration released its American Patients First blueprint, claimed to have achieved less brand-name drug price increases and more drug price decreases than the same period in 2017. While this is great to hear, we wanted to learn more about what this means for consumers. This 46brooklyn report highlights where the Trump administration seems to be making headway, where things still seem incomplete, and why despite any progress made on list prices, it may not mean that spending on prescription drugs has declined.

Read More
Ben LinkHHS, Trump, drug prices, NADAC, Pfizer
Hydroxychloroquine: What goes up… stays up?

It is well-known that competition in the generic manufacturer marketplace drives drug prices down considerably. Plaquenil, a brand-name drug that has been on the market since 1955, eventually saw generics enter the market almost a quarter of a century ago. By all accounts, generic Plaquenil – known as hydroxychloroquine – had become a very affordable drug at approximately 10 cents per pill. But FDA actions quickly dried up the supply of the drug, causing prices to balloon more than 2,500%. This report examines how state Medicaid programs were impacted by this price spike, and how some states continued paying elevated rates even after the price came crashing back down.

Read More
The cancerous design of the U.S. drug pricing system

Of all the drugs in the marketplace, few have been as much of a topic of conversation as Gleevec, a popular medication for cancer patients. While the brand manufacturer Novartis was frequently criticized for its price increases during its exclusivity period, when the generics entered the market, prices of those versions plummeted. But in analyzing CMS data, we found that even though prices were crashing, some state Medicaid programs were still being charged much higher prices.

Read More