
Welcome to the 46brooklyn drug price Launchpad
After about a five-year stretch of a declined emphasis on annual list price increases on brand-name drugs, in 2022, those trends began to pivot slightly. But as you can see from our price increase tracker, the 46brooklyn Brand Drug List Price Change Box Score, that slight uptick in price increase activity still pales in comparison to the hikes we were used to seeing before 2016.
The issue of list price increases became even more noteworthy with the signing of the Inflation Reduction Act (IRA) in 2022, which among a number of other drug pricing reforms, included provisions that create rebate penalties for drugmakers who raise their list prices higher than broader rates of inflation. While there has been some debate on the appropriateness of the policy and whether it could drive manufacturers to raise prices more than they otherwise would during periods of hyper inflation, more importantly perhaps is how the the new annual price increase constraints might impact drugmaker incentives to launch new products at even higher prices than they were previously.
The rationale goes like this: regardless of whether the reason is growing costs of doing business, increasing profits, greater rebate demands, or other changing market dynamics, drugmakers value the ability to adjust their prices upwards over time. If under the IRA, the ability for drugmakers to calibrate prices in the way want to over time is now constrained and potentially difficult to plan for (subject to an outside influence of CPI-based inflation), drugmakers would be left with even stronger incentives to overstuff the prices of their drugs at launch, which would give them greater cushion in the long term.
This isn’t just theory. There are a diverse set of industry experts who believe that the IRA will juice launch prices even more, including the Congressional Budget Office.
We previously did a deep dive on launch prices three years ago when we noticed that an undue focus on brand drug list price increases year-over-year was potentially missing the broader point that the alternative for manufacturers to taking list price increases each year would be to simply set a list price high out of the gate and never change it – or to not be as reliant on price increases over time. This is territory that has been traversed in different ways by others recently, including Reuters, Harvard researchers, the Congressional Budget Office (CBO), and more recently, Rep. Katie Porter. With the growing attention on launch prices, we were aware that we hadn’t updated our old launch price dashboard in some time; so we set out to re-launch the dashboard and offer some additional data-driven context to launch prices as they have been experienced over the last 10 years, particularly in relation to our ongoing work on monitoring drug price increases.
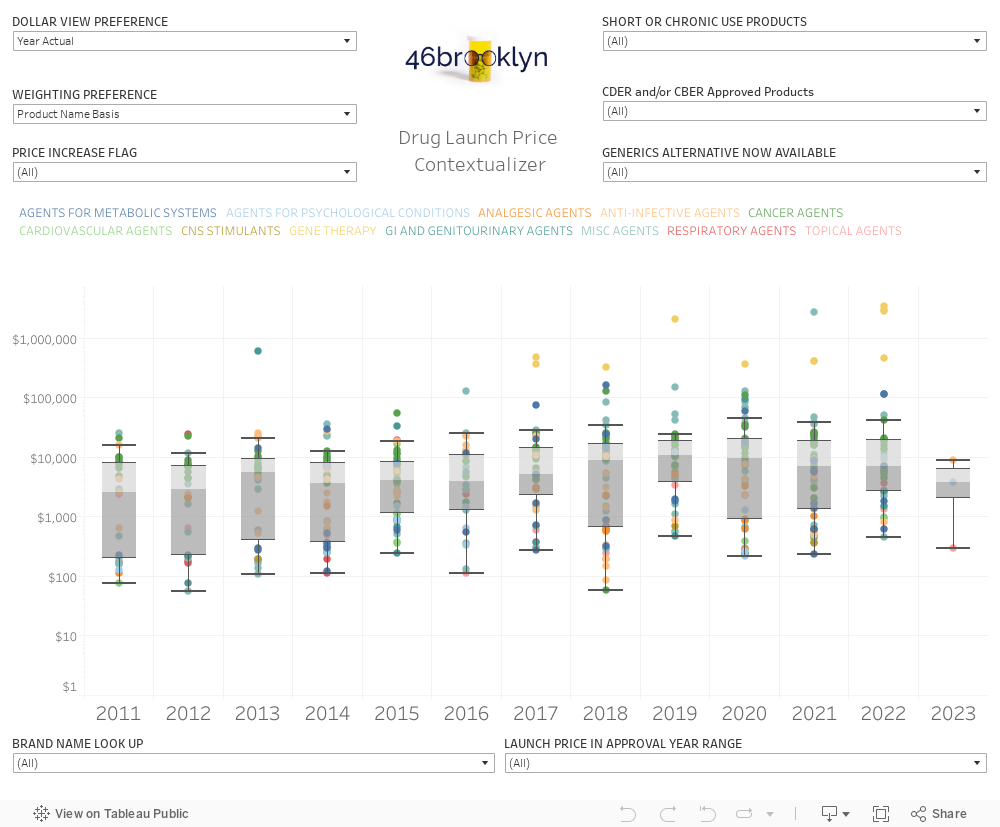
So in an effort to examine and contextualize prior launch price activity and to look ahead at future in a post-IRA world, we are pleased to give you our new and improved 46brooklyn Drug Launch Price Contextualizer.
If you are interested in learning more about this visualization, or reading our thoughts on what this tells us, please make sure to read the companion research report to this visualization.
Data sources and how we created the data set
The work required to assemble this dashboard arguably puts many of our other visualizations to shame. Most of the raw data we needed was obtained from Elsevier’s Gold Standard Drug Database, but identifying the initial launch price for every distinct drug required stitching together multiple tables within their proprietary database. Similarly, work was required to stitch together the prices, manufacturers, and therapeutic classes from within their database for the identified drugs.
The most onerous part of the process was to develop usual/common dosages to be able to estimate one-month treatment costs, as well as to identify whether products would likely be used on a short-term or chronic basis. We do not license this data from Elsevier, so we custom built this table manually combining the following sources.
Package inserts posted on DailyMed
We also changed the way we identify launch prices from prior versions of this dashboard. Rather than calculate launch prices for all products based upon when they first appear in data, we limited the products of interest to those identified by Center for Drug Evaluation and Research (CDER) and Center for Biologics Evaluation and Research (CBER). Specifically, we only looked for the first price in the database for products that appeared on the annual reports of those organizations for new entities since 2011. This means our database still treats the launch price date based upon what the database says and not the CDER / CBER reports. Consider a recent product example like Adbry. This product was approved by the FDA on 12/27/2021. While our dashboard has Adbry within it, it identifies the launch price in 2022, not 2021, because that is the date the price was published. We don’t think these differences are meaningful overall, but it is important to note that our launch prices are derived not upon the approval date of the drug, but based on the publication of the product’s price (which can have an impact on trending launch prices year-over-year). Nevertheless, we give users the opportunity to limit the view of the dashboard to just those drugs whose launch price year in data is within two-years of the published CDER/CBER date. (See our How to Use section below)
Limitations
It goes without saying that with as much manual assembly work as it took to develop our custom usual/common dosage database, it’s unlikely that every single one-month treatment cost is correct. If you see anything that looks blatantly wrong, shoot us a note and we’ll research and fix it.
All brand-drug treatment costs are based on pre-rebate Wholesale Acquisition Costs (WACs), which for larger payers are not a good representation of true net costs (please read up on the gross to net bubble). However, pre-rebate brand pricing is still very relevant as it can be the basis for the prices paid by uninsured and underinsured patients at the pharmacy counter, but also in that high brand drug list prices often give birth to high generic drug list prices. Please see our 2019 launch price report (based on the old version of this dashboard) to this visualization for an extensive discussion on this topic.
How to Use
The Drug Launch Price Contextualizer is probably our most complicated dashboard for a user to engage with. There are eight different ways to re-contextualize the data (with some alternative ways within the seven large buckets). At a high level, the user is given the following tools to evaluate launch prices of products over time based on a box-and-whisker plot:
Dollar View Preference allows the user to toggle between a view of launch prices as reported in the year the product was launched or re-scaled to 2023 equivalent dollars (based upon the CPI-index). A 2011 dollar is nearly 30% more valuable than a 2023 dollar due to the compounding effects of inflation, and this toggle gives the user the choice of which dollar view they prefer.
Weighting Preference allows the user to toggle between different ways to conceptualize the impact of launch prices. The default is Product Name Basis, which treats each product’s impact to launch prices equally. The Medicaid and Medicare options weights the launch prices based upon how much of the drug was used in the respective program in the year following launch. In this way, the impact of the newly launched products can be contextualized to something beyond just the number of products approved in a year, and instead be based on the role/impact they had to either program. We encourage users to experiment with the weighting, because results are pretty different between each.
Price Increase Flag allows the user to identify products whose launch price (as contextualized in this dashboard), is not equivalent to their current price because the manufacturers’ current list price is higher. There is a lot of research on why brand prices change over time, and if you’re interested in controlling for this potentially confounding variable, this toggle gives you the option to evaluate trends across products that have launched at one price, and taken price increases over time vs. products whose launch price is still their current price.
Short or Chronic Use Products allows the user to toggle launch price information for products that are considered short-term products or chronic use products. Short-term products are not anticipated to be used forever by the user (such as anti-infective medications or cancer therapies). In comparison, chronic use products are those products where patients might be reasonably expected to use them for a year or more (such as an insulin product). We developed this list based on an internal review of the products, and while believe we have appropriately categorized them, it’s possible we got a flag or two wrong, so if you see something wrong, let us know.
CDER and/or CBER Approved Products allows the user to toggle between pricing trends based on whether the underlying product’s approval process was via CDER or CBER.
Generic Alternative Now Available allows the user to toggle between pricing trends based on whether the underlying products now have an interchangeable, alternative version available (i.e., a generic alternative, but also a biosimilar to the extent that it exists).
Therapeutic Category Click Through allows users to click on one of the colored text descriptions of drug categories (which aligns to the colored dots in the plot) to evaluate launch price trends for products categorized within the 12 different drug categories flagged by 46brooklyn. We developed these categories based on an internal review of the products, so if you see one worth nitpicking, let us know.
Launch Price in Approval Year Range allows users to toggle the dashboard to include or exclude products based on whether the launch year of the product we identify is within two years of the CDER / CBER approval year. For example, selecting “True” will include a product approved by CDER in 2011, but whose launch price is in 2012 in our database, but not one whose launch price was in 2014 (if it was also approved by CDER in 2011).
Finally, individual drugs can be identified through the Brand Name Look Up function of the dashboard (though it kind of defeats the purpose of the box-and-whisker plot to look at just an individual product).
For more information on how to use the tool, please see our companion report that provides insights on the data.
Update Frequency
Yearly (after publication of CDER / CBER Annual Reports)
v 2.0 - posted March 9, 2023