
What’s happening to generic drug prices? January 2020 NADAC Survey Update
CMS released its latest NADAC survey results, which means it’s time to check in on the latest generic drug price changes. Be sure to click through our new updated visualizations (NADAC Change Packed Bubble Chart and Drug Pricing Dashboard) to see the impact of the latest changes.
As a reminder, each month, retail community pharmacies across the country are surveyed by Myers Stauffer (on behalf of the Centers for Medicare and Medicaid Services) on their wholesaler invoice prices. The results are then compiled and released either the third or fourth week of the following month. On January 22nd, survey results were released that reflect National Average Drug Acquisition Cost (NADAC) price changes from December.
Here are our top takeaways on last month’s results:
1. Positive month for unweighted price changes
Each month, we first look at how many generic drugs went up and down in the latest month’s survey of retail pharmacy acquisition costs, and compare that to the prior month. As shown in Figure 1, January was a step in the right direction when compared to December, at least if you are a fan of (unweighted) generic drug deflation.
Basically, the quick way to read the chart below is to look for blue bars that are taller than orange bars to the left of the dotted line and exactly the opposite to the right of the dotted line. That indicates a good month – more generic drugs went down in price compared to the prior month, and less went up.
In other words, January was a “good” month:
Figure 1
Source: Data.Medicaid.gov, 46brooklyn Research
To put some numbers to this, for every generic drug that experienced a price decline this month, there were 0.86 generic drugs that experienced a price increase. That’s down considerably from a ratio of 1.09 last month. “Down” is good — unless you are a drug wholesaler or a generic manufacturer.
In December, there were 12% more generic drugs that experienced a 0-10% price decrease and 17% more generic drugs that experienced a price decrease of more than 10%. Continuing with the good news, there were also 15% fewer drugs that experienced a 0-10% price increase. The only blemish on an otherwise stellar month of unweighted priced changes was the 1% increase in the number of generic drugs that experienced a price increase of more than 10%.
What a happy ending to this month’s story! This will undoubtedly go down in history as the shortest 46brooklyn report of all time …
Except that little caveat that these are unweighted numbers, and largely meaningless for folks paying the bills for drugs. So we better go ahead and look at the weighted picture again, right? And as seems to be the case just about every month as of late, that story is quite different …
2. Weighted Medicaid deflation sinks to only $18 million
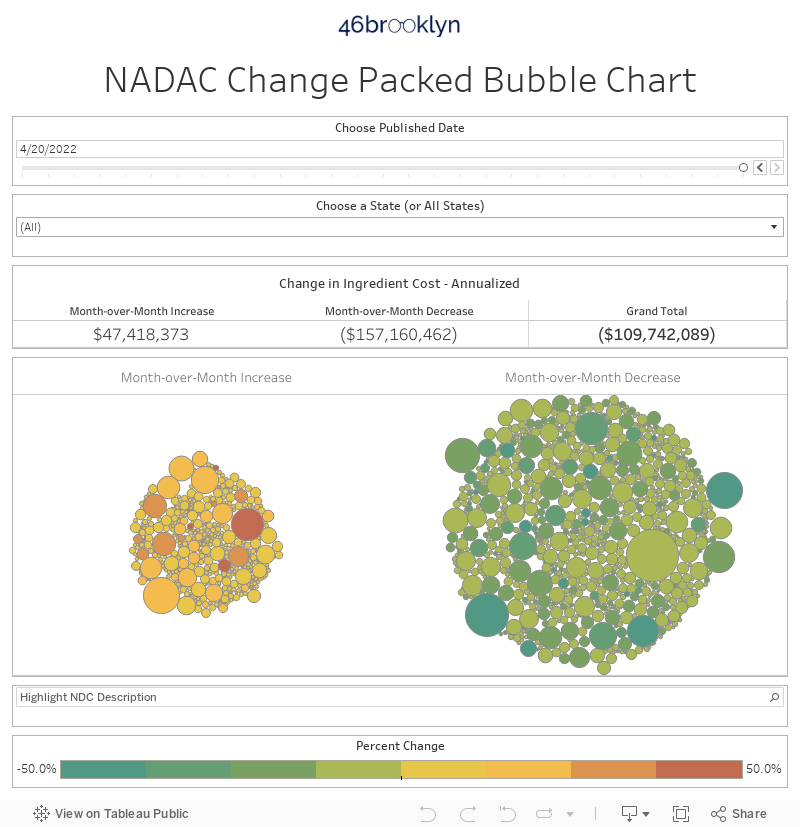
As we’ve written in prior updates, knowing the price change alone is not enough. We need to apply utilization (drug mix) to the price changes, which is the purpose of the NADAC Change Packed Bubble Chart (embedded below). We use Medicaid’s Q3 2018 through Q2 2019 drug mix to arrive at an estimate of the total dollar impact of the latest NADAC pricing update. This helps quantify the real impact of those price changes from a payer’s perspective.
The green bubbles on the right of the below viz are the generic drugs that experienced a price decline in the latest survey, while the yellow/orange/red bubbles on the left are those drugs that experienced a price increase. The size of each bubble represents the dollar impact of the drug on Medicaid, based on utilization of the drug in the most recent trailing 12-month period. Stated differently, we simply multiply the latest survey price change by aggregate drug utilization in Medicaid over the past year, add up all the bubbles, and we get the total inflation/deflation impact of the survey changes.
So while Figure 1 may make us feel fantastic about January price changes, this month’s “winners” (i.e. deflationary drugs) tended to be lower-utilization drugs than this month’s “losers.” Put it all together, and the weighted impact to Medicaid of the latest monthly survey decreased to $18 million in deflation, degrading from $67 million last month.
3. Year-over-year deflation falls below 8%
Trailing-twelve-month generic deflation once again set a fresh 24-month low, coming in at just 7.8% (Figure 2).

Figure 2
Source: Data.Medicaid.gov, 46brooklyn Research
Is it just us, or does this feel like we are watching a super slow motion train wreck? It seems that the disappearance of stable-mix generic deflation is happening just slowly enough for no one to really notice it. It’s the proverbial frog in boiling water. Moreover, the whole development is interspersed with months of nice healthy deflation, upon which we can all get out our recency bias party hats and convince ourselves “there’s nothing wrong here.” And then a sobering month (like this one) comes in, which makes us once again confront the reality of this situation, which to be clear, is that year-over-year stable mix generic deflation appears to be in structural (or at least, cyclical?) decline.
For those readers that missed last month’s update, we spent considerable time discussing the limitations of this stable-mix analysis – namely that it doesn’t capture the deflationary benefits of new generics (think Lyrica) coming to market at extremely cheap launch acquisition costs. So please don’t look at this metric and conclude that the deflationary impact of all generics is disappearing. That would be an inaccurate conclusion.
You can however conclude that the same generic drugs available one year ago are not getting cheaper as quickly as they used to. Which as we seek to increase the number of people with access to healthcare (which by the way declined in 2018 relative to 2017 for the first time in several years), ain’t such a great thing. We wonder how much the powers that be are counting on this historical deflationary trend on generic drugs to continue, and what happens if it does not.
Actually, that’s a silly concern. Of course we’ll just print some more money and then borrow it to pay for this. Easy. Peasy.
But what do we know? We just write about drugs.
4. Generic Norco price increases as much as 42%
Hydrocodone-acetaminophen (APAP) products are opioid medications used for pain relief. Generic Norco (hydrocodone-APAP) products come in various strengths, including 5-325 mg, 7.5-325 mg, and 10-325 mg. As shown in Figure 3, all three strengths experienced a sudden and sharp price increase this month (5-325 mg up 34%, 7.5-325 mg up 42%, and 10-325 mg up 16%), after five years of steady deflation (driven by a marked growth in manufacturer competition, which you’ll see if you select these drugs in our NADAC Drug Dashboard and hover over the line). Of note, the price increases this month on Hydrocodone-APAP were the most significant we have seen since late-2014, when it was reclassified by the FDA as a Schedule II controlled substance.
Figure 3
Source: Data.Medicaid.gov, 46brooklyn Research
Aggregating these cost increases to the state Medicaid drug utilization for these products will add an estimated $9.5 million per year in annualized ingredient costs.
We could not help but dig in further to this notable pricing movement on arguably one of the the most notable types of drugs. This really caught our attention, because these increases come just a couple months after opioid manufacturers and distributors were beginning to settle opioid litigation cases. Either really unfortunate timing for these manufacturers, or possibly there’s something more to study here.
In Figure 4, we see that the opioid manufacturers involved in the settlement conversations and their generic subsidiaries correspond to roughly two-thirds of Medicaid opioid drug utilization.
Figure 4
Source: Data.Medicaid.gov, 46brooklyn Research
Interesting information, but far from enough to imply any causality here. Especially when we consider that demand for these products has arguably never been lower. Significant efforts at the national and state levels have been aimed at decreasing opioid utilization. We can see some the success of these efforts if we look at all state utilization within Medicaid for these hydrocodone-acetaminophen products. As seen in Figure 5, from Q1 2018 to Q1 2019 (the most recent quarter of full Medicaid utilization data), we see a decline of 23% in terms of number of prescriptions dispensed within Medicaid for these products.
Figure 5
Source: Data.Medicaid.gov, 46brooklyn Research
Ordinarily, one should expect decreasing demand/utilization to put downward pressure on prices of a product, but drugs aren’t your “average bear” products. Generally, we would consider drugs to to be inelastic products. Think back to the last time your doc prescribed one pill per day of Drug X. Did you push back on him or her saying, “sorry, doc, the price of Drug X is up 15% compared to last time you prescribed it, so you better reduce what you are prescribing to even the cost out.” Likely not. You just followed doctor’s orders and filled the same amount as last month despite the price increase. That’s inelastic demand.
Now opioids are a special kind of inelastic drug – namely, one that is also addictive. The best example of a product that is addictive and has inelastic demand (maybe because it’s addictive) is cigarettes. Cigarette demand has been in structural decline for years now; yet, according to the Wall Street Journal, “U.S. tobacco revenue is soaring, thanks to years of steady price hikes.” Putting some numbers to this, “the operating profits of U.S. tobacco manufacturers have grown 77% since 2006 to $18.4 billion in 2016.” That’s despite a 30% decline in the total domestic cigarette units sold over the same period. Let us all marvel at the economic wonder that is pricing increases on an addictive product!
So are opioids the new cigarettes? That’s far too much of a stretch for even us to make at just the sign of this first price increase. But the cigarette industry offers an interesting analogy that we should keep in the back of our minds as we move forward. And you know us: we are all about our analogies.
Plus, this little diversion helped distract us from coming to any sort of conclusion on whether manufacturers or wholesalers simply increased prices to fund their settlements, a concern already voiced by both the Massachusetts and New York attorney generals. We’re fairly certain William of Ockham (of Occam’s Razor fame) would be a fan of this theory. But sadly, we don’t have enough information to prove this. All we can definitively state is that the price of this addictive, inelastic “good” went up meaningfully, pretty soon after its manufacturers settled some lawsuits. Discuss amongst ya’selves.
5. Generic Suboxone takes a brief break from its steep decline
Continuing with opioids, generic Suboxone (buprenorphine-naloxone) is the most commonly used medication to treat opioid dependence, such as what may develop following misuse of hydrocodone-APAP products. Unsurprisingly, given what was just discussed above, the use of generic Suboxone products has grown by 22% over the last five quarters as efforts are made to combat opioid addiction.
Figure 6
Source: Data.Medicaid.gov, 46brooklyn Research
And just in case we forgot that drug pricing works in the exact opposite way we would expect, the accelerating demand for generic Suboxone resulted in a dramatic drop in the cost of this drug (Figure 7). While both strengths did step up a bit this last month (8-2 mg up 19%; 2-0.5 mg up 13%), that shouldn’t take away from the ski slope decline in pricing that the generic marketplace has collectively delivered over the past six years on this drug, easing the cost burden to mitigate the ongoing opioid epidemic.
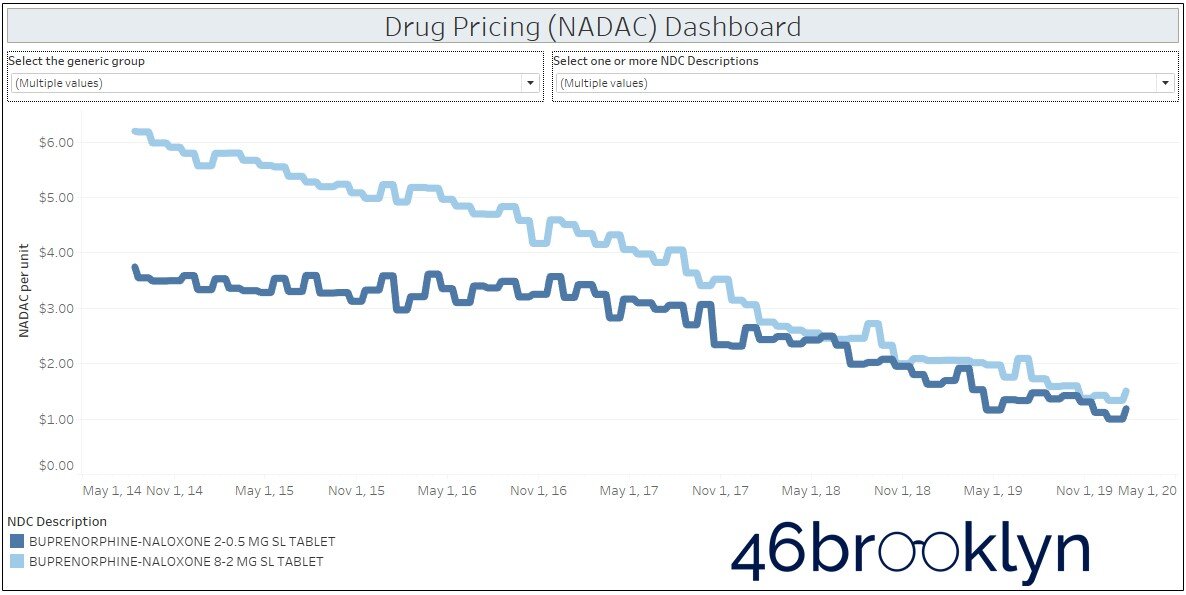
Figure 7
Source: Data.Medicaid.gov, 46brooklyn Research
In a normal marketplace, this would be bad news for opioid manufacturers. The product that helps people not use your product is getting way cheaper. Logic would point to steeper volume declines ahead for opioid manufacturers. But this is where logic breaks down. Volume declines may or may not be a bad thing for opioid manufacturers. It really all depends on what they do with the price of their addictive, inelastic product. If we’ve learned anything from our research for this report, if opioid manufacturers follow the cigarette manufacturers’ pricing playbook, their best days could still lie ahead!
What are you seeing?
While we spend more time than we’d like to admit studying the pricing changes during each NADAC Survey Results Week, we don’t always catch every story worth noting. Be sure to take a gander at all of our updated Visualizations that rely on NADAC prices. If you’re seeing any interesting movement on drugs in the dataset, let us know.
Thanks to Bob Herman at Axios for taking our recent deep dive on Medicare Part D spending and building on it by doing a larger rebate analysis that included Medicaid and Medicare Part B. Just great stuff from Bob, as always.
Additional praise goes to Terrie Morgan-Besecker at The Times-Tribune in Scranton for putting in a ton of work studying our visualizations and CMS data to unlock some of the big pricing distortions in the Pennsylvania Medicaid managed care program. Her digging into the data and pressing on state officials yielded new findings of significant rates of spread pricing in the Commonwealth. The importance of good local journalism cannot be overstated.