
What’s happening to generic drug prices? December 2019 NADAC Survey Update
Happy New Year. In honor of the calendar hitting 2020, we wanted to be sure to send you some good drug pricing updates to read while you’re waiting for the giant stiletto to drop. CMS once again recently released their latest NADAC survey results, which means it’s time to check in on the latest generic drug price changes. Hope your champagne is on ice.
There was a lot of movement on drug prices last month (there always is … which means it’s OK for us to regurgitate this same statement each month, which if you haven’t been paying attention — we do), so be sure to click through our new updated visualizations (NADAC Change Packed Bubble Chart and Drug Pricing Dashboard) to see the impact.
As a reminder, each month, retail community pharmacies across the country are surveyed by Myers Stauffer (on behalf of the Centers for Medicare and Medicaid Services) on their wholesaler invoice prices. The results are then compiled and released either the third or fourth week of the following month. On December 18th, survey results were released that reflect National Average Drug Acquisition Cost (NADAC) price changes from November.
Here are our top takeaways on last month’s results:
1. Unweighted price changes take a step in wrong direction
Each month, we first look at how many generic drugs went up and down in the latest month’s survey of retail pharmacy acquisition costs, and compare that to the prior month. As shown in Figure 1, December was a weaker showing than November, at least if you are a fan of (unweighted) generic drug deflation.
Basically, the quick way to read the chart below is to look for blue bars that are taller than orange bars to the left of the dotted line and exactly the opposite to the right of the dotted line. That indicates a good month – more generic drugs went down in price compared to the prior month, and less went up.
That’s clearly not what happened in December.
Figure 1
Source: Data.Medicaid.gov, 46brooklyn Research
To put some numbers to this, for every generic drug that experienced a price decline this month, there were 1.09 generic drugs that experienced a price increase. That’s up from a ratio of 0.86 last month. Again, “up” is not good — unless you are a drug wholesaler or a generic manufacturer.
In December, there were 7% fewer generic drugs that experienced a 0-10% price decrease and 11% fewer generic drugs that experienced a price decrease of more than 10%. Also, there were 13% more drugs that experienced a 0-10% price increase, and 31% more drugs that experienced a price increase of more than 10%.
Doesn't look good, does it? But for frequent 46b readers, you know better than to come to any conclusions based on unweighted numbers, right?
2. Weighted Medicaid deflation increases to $67 million
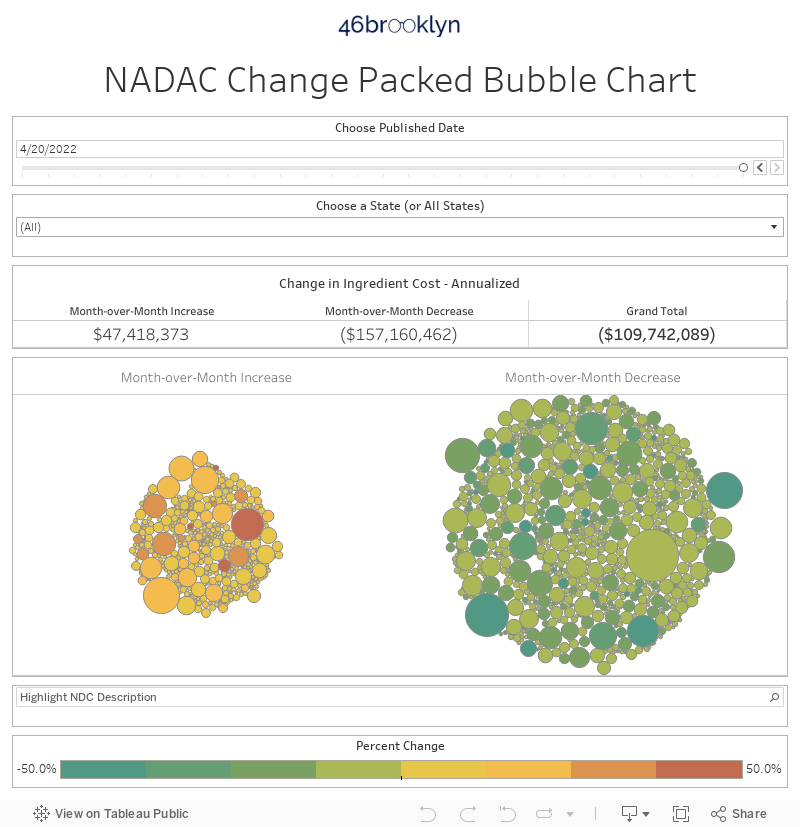
As we’ve written in prior updates, knowing the price change alone is not enough. We need to apply utilization (drug mix) to the price changes, which is the purpose of the NADAC Change Packed Bubble Chart (embedded below). We use Medicaid’s Q3 2018 through Q2 2019 drug mix to arrive at an estimate of the total dollar impact of the latest NADAC pricing update. This helps quantify the real impact of those price changes from a payer’s perspective.
The green bubbles on the right of the below viz are the generic drugs that experienced a price decline in the latest survey, while the yellow/orange/red bubbles on the left are those drugs that experienced a price increase. The size of each bubble represents the dollar impact of the drug on Medicaid, based on utilization of the drug in the most recent trailing 12-month period. Stated differently, we simply multiply the latest survey price change by aggregate drug utilization in Medicaid over the past year, add up all the bubbles, and we get the total inflation/deflation impact of the survey changes.
So while Figure 1 may make us feel a bit down about December price changes, this month’s “winners” (i.e. deflationary drugs) tended to be higher-utilization drugs than this month’s “losers.” Put it all together, and the weighted impact to Medicaid of the latest monthly survey increased to $67 million in deflation, an improvement from $11 million last month.
3. Year-over-year deflation rebounds to 10.0%
Trailing-twelve-month generic deflation bounced a bit off the 24-month low set in November, hitting 10.0%.

Figure 2
Source: Data.Medicaid.gov, 46brooklyn Research
While this analysis tends to show fluctuation from month-to-month, it is now very clear that generic deflation is slowing. While December brought a brief reprieve from single-digit deflation, we suspect (call it an educated guess at best?) that this was just a dead-cat bounce.
By the way, if you’re curious about how we created the above chart, take a look at our June 2019 NADAC survey report for more detail on our methodology.
We should note that this deflation tracker does not capture what could be some very favorable deflationary dynamics. Take generic Lyrica (pregabalin) for example. As we wrote in July, it came to market with 10 competing manufacturers, carrying a pharmacy acquisition cost that was just 3% of trademarked Lyrica. As shown in Figure 3, its latest NADAC is just $0.15 per tablet, while Lyrica’s NADAC is $7.48. This means that the average retail pharmacy can acquire 50 generic Lyrica capsules for the price of one brand-name Lyrica capsule.
Figure 3
Source: Data.Medicaid.gov, FDA.gov, 46brooklyn Research
It’s critical to note that our generic deflation tracker only measures the change in a stable mix of generics from one year to the next, not the savings associated with a generic entering the market at ever lower prices. Clearly, if generics continue to launch at just cents on the dollar relative to their brand equivalent, there isn’t much room for prices to go down from there. This would be “bad” for stable mix generic deflation, but extremely good for drug price deflation in general. Stated differently, the more efficient the generic marketplace is on day 1 of a generic’s launch, the more (wrongly) unfavorable our generic deflation tracker will look.
So long story short, no one figure or chart can comprehensively tell the full drug pricing story. There are always more questions to ask and ways to look at the prescription drug marketplace to see the complete picture of what’s occurring. This is the story of 46brooklyn. It’s why our reports are so dang long-winded and packed with charts and visualizations. It’s also why we are so forthcoming about what we know and what we don’t know. We try to do our best to educate readers on what questions to ask, even if we cannot always answer them ourselves. And then we supply whatever data sources we use so that you can replicate for yourself.
Anyway, we’ll have to put some thought into how we create a new tracker to capture the impact of new generic entries. Please send us nastigrams if we forget to put something out on this in the next couple months.
4. Generic Hyzaar price increases by ~50%
With over 15 instances of recalls made by drug manufacturers in 2019, it seems safe to say that it wasn’t a good year for the manufacturers of losartan products. While we can’t blame them for wanting to put 2019 behind them, we can’t help but wonder if their problems have only just begun. We also can’t help but notice that this highly-competitive category (over 10 labelers making each strength and dosage form) is seeing some massive price increases at the end of the year (Figure 4). What started with the generic Cozaar (losartan) products in September 2019 (50% price increases) has reached the generic Hyzaar (losartan-hydrochlorothiazide) products here in December (50% price increase).
Figure 4
Source: Data.Medicaid.gov, FDA.gov, 46brooklyn Research
So here we have a situation where some generic drug manufacturers supplied allegedly sub-quality product. This yielded product recalls that the FDA warned could cause shortages. The shortages came. FDA tried to minimize those shortages by temporarily loosening quality standards. More recalls came. And kept coming. And as a result of the tightening of access, as you can see, the price is now moving northward at an aggressive end-of-year pace.
We don’t spend a lot of time talking about the majority of drugs that are 10-15 cents per pill. They’re so mature and inexpensive that they typically fall off of our radar, displaced by the generic Gleevecs of the world whose price charts remind you of base jumping.
But this losartan example offers an interesting counterpoint. It raises the question whether a generic drug can be too cheap? When does incremental pricing pressure switch from being a good thing to a bad thing, increasing risk of quality issues for minimal additional benefit? Sounds like we need to finally finish reading Bottle of Lies.
The other interesting takeaway is how rapidly prices shot up, erasing years of gradual deflation in a matter of months. It makes us wonder what the appropriate “clearing price” is for this drug, and how much further it could overshoot such a number. It also makes us wonder whether we are seeing another valsartan situation, where generic manufacturers are capitalizing on the market chaos and saying to themselves, “we do see disruptions all the time and if we can react quickly to it, you can capture some opportunities."
Unfortunately, there is no public data available to even roughly gauge how much this drug costs to produce. So the true motive for these increases will remain a mystery, which we can only assess by retroactively studying the random walk of generic drug pricing.
5. Generic Kapvay continues its downward trend
One of the largest drops this month in prices is clonidine ER 0.1 mg. With a 31.3% drop in unit price, this non-stimulant ADHD medication seems to be trending downward into 2020; which is a phenomenon we hope continues as it is estimated to reduce costs to Medicaid by $5.7 million (if 2019 utilization remains consistent along with the price drop, and if the supply chain decides to pass along the savings).
Figure 5
Source: Data.Medicaid.gov, FDA.gov, 46brooklyn Research
The FDA has approved a total of three non-stimulants to treat the symptoms of ADHD: Strattera (atomoxetine), Intuniv (guanfacine ER), and Kapvay (clonidine ER). Each of these provide a useful alternative for children who do not tolerate stimulants (e.g. methylphenidate — a product we’ve written a great deal about for regular readers of our previous NADAC updates). Guanfacine is the lowest cost of the non-stimulant options, with clonidine ER and atomoxetine being approximately equivalent depending upon dose. All the non-stimulants tend to be lower in cost than the stimulant alternatives.
6. Generic Prograf prices came back down
In October and November, we highlighted how generic Prograf (tacrolimus) was experiencing some weird price spikes and drops, and this month is no different.
December’s update shows tacrolimus 0.5 mg increasing by $0.05 per capsule, tacrolimus 1 mg increasing by $0.06 per capsule, and tacrolimus 5 mg decreasing by $1.54 per capsule (Figure 6).
Figure 6
Source: Data.Medicaid.gov, FDA.gov, 46brooklyn Research
What are you seeing?
While we spend more time than we’d like to admit studying the pricing changes during each NADAC Survey Results Week, we don’t always catch every story worth noting. Be sure to take a gander at all of our updated Visualizations that rely on NADAC prices. If you’re seeing any interesting movement on drugs in the dataset, let us know.
We’d like to give a huge shout-out to the Columbus Dispatch, whose massive “Side Effects” investigation into drug pricing and the role of PBMs is close to hitting the two-year mark. Reporters Darrel Rowland and Cathy Candisky closed out the year with a huge deep-dive into the setting average wholesale price (AWP), its poor representation of true generic drug prices, and its status as the backbone of most payer contracts with PBMs. Not only did they do an excellent job covering the bases, but they made it astoundingly accessible for the general public. Give their excellent piece a read here.
Also, thanks to Shari Rudavsky at the Indianapolis Star for chatting with 46brooklyn’s Antonio Ciaccia about the structural issues with insulin prices, and how their over-inflated list prices are adversely impacting patients. In the piece, Ciaccia discusses how the recent trend of well-intended state laws capping insulin co-pays both unfortunately ignores the root problem and risks pushing over-inflated drug costs onto patients with other life-threatening diseases.