
What’s happening to generic drug prices? February 2020 NADAC Survey Update
CMS released its latest National Average Drug Acquisition Cost (NADAC) survey results, which means it’s time to check in on the latest generic drug price changes. Be sure to click through our new updated visualizations (NADAC Change Packed Bubble Chart and Drug Pricing Dashboard) to see the impact of the latest changes.
As a reminder, each month, retail community pharmacies across the country are surveyed by Myers Stauffer (on behalf of the Centers for Medicare and Medicaid Services) on their wholesaler invoice prices. The results are then compiled and released either the third or fourth week of the following month. On February 19th, survey results were released that reflect NADAC price changes from January.
Here are our top takeaways on last month’s results:
1. Not a great month for unweighted price changes
Each month, we first look at how many generic drugs went up and down in the latest month’s survey of retail pharmacy acquisition costs, and compare that to the prior month. As shown in Figure 1, February was a step in the wrong direction when compared to January, at least if you are a fan of (unweighted) generic drug deflation.
Basically, the quick way to read the chart below is to look for blue bars that are taller than orange bars to the left of the dotted line and exactly the opposite to the right of the dotted line. That would indicate a good month – more generic drugs going down in price compared to the prior month, and less drug prices going up.
In February, the opposite happened:
Figure 1
Source: Data.Medicaid.gov, 46brooklyn Research
To put some numbers to this, for every generic drug that experienced a price decline in this month’s update, there were 1.02 generic drugs that experienced a price increase. That’s up from a ratio of 0.86 last month. “Up” is not good — unless you are a drug wholesaler or a generic manufacturer.
In February, there were 8% fewer generic drugs that experienced a 0-10% price decrease and 7% fewer generic drugs that experienced a price decrease of more than 10%. Continuing with the bad news, there were also 16% more drugs that experienced a 0-10% price increase. The only bright spot within an otherwise forgettable month of unweighted priced changes was the 8% decrease in the number of generic drugs that experienced a price increase of more than 10%.
2. $27 million in weighted Medicaid generic inflation (that’s right inflation!)
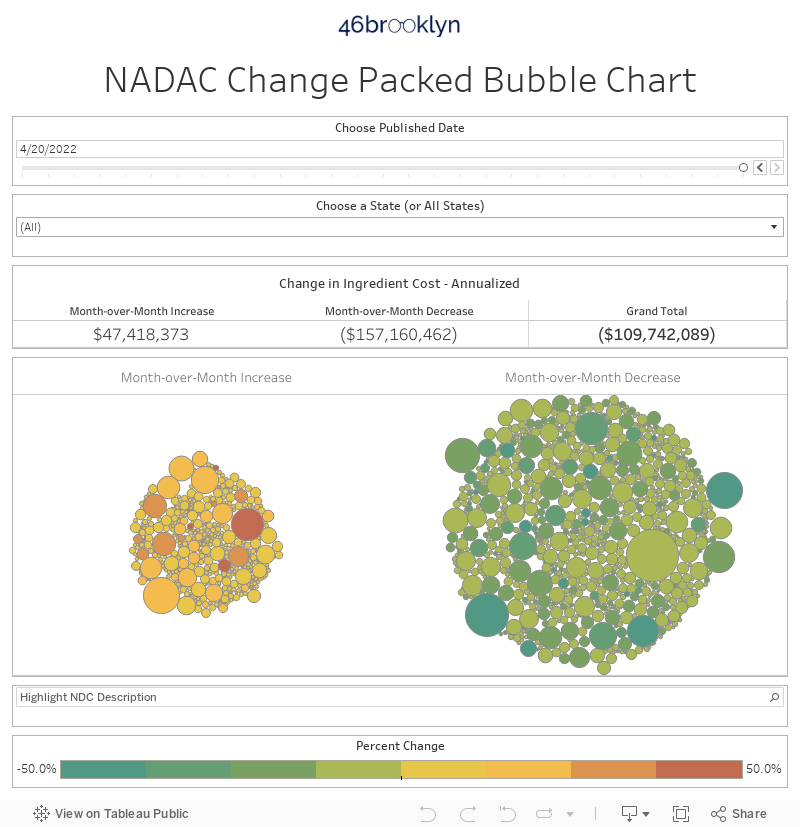
As we’ve written in prior updates, knowing the price change alone is not enough. We need to apply utilization (drug mix) to the price changes, which is the purpose of the NADAC Change Packed Bubble Chart (embedded below). We use Medicaid’s Q3 2018 through Q2 2019 drug mix to arrive at an estimate of the total dollar impact of the latest NADAC pricing update. This helps quantify the real impact of those price changes from a payer’s perspective.
The green bubbles on the right of the below viz are the generic drugs that experienced a price decline in the latest survey, while the yellow/orange/red bubbles on the left are those drugs that experienced a price increase. The size of each bubble represents the dollar impact of the drug on Medicaid, based on utilization of the drug in the most recent trailing 12-month period. Stated differently, we simply multiply the latest survey price change by aggregate drug utilization in Medicaid over the past year, add up all the bubbles, and we get the total inflation/deflation impact of the survey changes.
Put it all together, and the weighted impact to Medicaid of the latest monthly survey was $27 million of generic inflation. That’s right folks – we said “generic” and “inflation” in the same sentence for the first time since our June 2019 update.
3. Year-over-year deflation is hanging around 8%
Despite all of the incremental bad news (if you’re a fan of deflating generic drug costs) in sections #1 and #2, as shown in Figure 2, the year-over-year deflation story was, well, a non-story this month, tip-toeing up to 8.3%. What can we say… math is freaky like that sometimes.

Figure 2
Source: Data.Medicaid.gov, 46brooklyn Research
It may appear that deflation is finding some support around 8%, but we wouldn’t get too comfortable here just yet – especially with coronavirus-driven drug shortage concerns lurking, which have yet to play out in the pricing data.
4. Generic Zantac (ranitidine) 150 mg tablets increase 63%
Generic Zantac (ranitidine) is a medication that relieves heartburn associated with acid indigestion and sour stomach. As shown in Figure 3 below, both ranitidine 150 mg and 300 mg spiked significantly in 2020. When compared to their sleepy December costs, the current cost of the 150 mg strength is up more than 50%, while the cost of the 300 mg strength has doubled.

Figure 3
Source: Data.Medicaid.gov, 46brooklyn Research
Since September 2019, generic Zantac (ranitidine) tablets have seen several recalls by at least 10 manufacturers (technically speaking, “labelers”). Consequently, the medication is currently in shortage through much of the United States.
To demonstrate the amount of utilization that has potentially been impacted due to these recalls, we took all currently available utilization data in Medicaid from 2019 (Q1-Q3) for ranitidine 150 mg tablets and quantified the amount of utilization associated with the recalled manufacturers compared to the non-recalled manufacturers. As shown in Figure 4 below, this recall has been disruptive, impacting potentially 39% of generic ranitidine utilization nationwide within Medicaid.

Figure 4
Source: Data.Medicaid.gov, 46brooklyn Research
As we discussed in our hydroxychloroquine report from 2018, these shortages and corresponding price increases can have a major impact on payer drug costs, even after the price of spiked drugs come back down. Because most state Medicaid manged care programs hand generic drug price setting over to the drug supply chain, shortages like this one provide a huge long-term opportunity for hefty up-charges.
5. Generic Gleevec (imatinib) declines as much as 58%
Generic Gleevec (imatinib mesylate) is a medication used to treat specific kinds of cancers; predominantly certain kinds of blood cancers. Originally approved by the FDA in 2001, Gleevec revolutionized treatment of a of blood cancer called chronic myelogenous leukemia (CML). Prior to the availability of imatinib-based treatment, CML was basically a death sentence. However, according to the National Cancer Institute, today, someone with CML who is in remission after two years of imatinib treatment has the same life expectancy as someone who doesn’t have cancer. Remarkable.
Since the generic versions of Gleevec launched in late 2016, the price of imatinib has been in a steady decline, as shown in Figure 5. This should come as no surprise to loyal 46brooklyn readers who have had to put up with our incessant complaining over the last 20 months about how payers (whether it be Medicare Part D or Medicaid) are not seeing the full benefits of the bludgeoning going on in the real market-clearing acquisition cost of imatinib. Well this month, those already relatively low acquisition costs for the 400 mg and 100 mg strengths took another 38% and 58% tumble, respectively. The much more common 400 mg strength is now down to a pharmacy acquisition cost of $5.81 per unit, which roughly translates to $2,100 per year. Just three years ago its annual acquisition cost was more than $60,000.
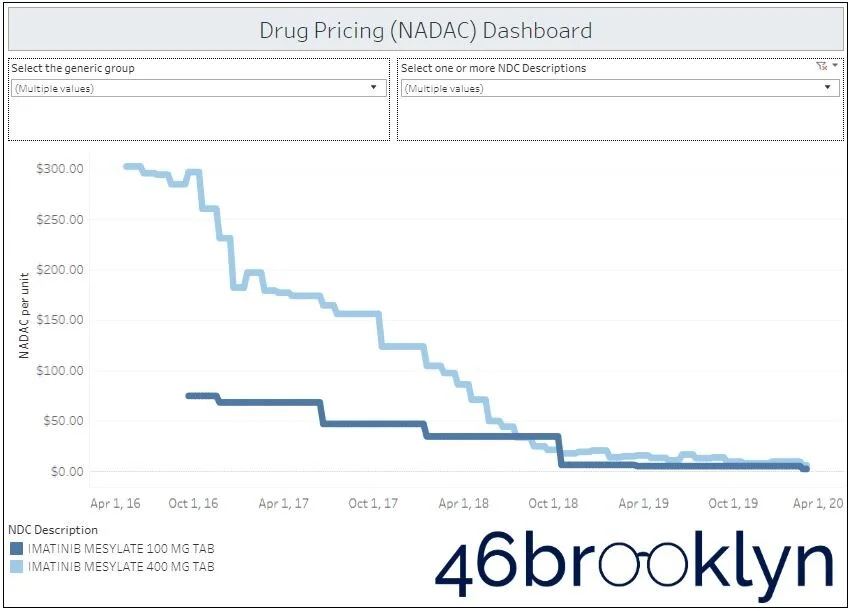
Figure 5
Source: Data.Medicaid.gov, 46brooklyn Research
It’s really important to note that this $5.81 per pill NADAC is not some unrealistic benchmark price. It’s a very real price that represents the true market for this drug. For those that are skeptical, take a journey over to GoodRx and search for this drug (30 count, 400 mg). In our area, we can go pick it up from Costco Pharmacy for $193.29 for a 30 day supply, which works out to $6.44 per pill (Figure 6), less than $1 per pill above the drug’s average pharmacy invoice cost.
Figure 6
Source: GoodRx
But take a close look at Figure 6. See the “est. retail price”? That’s the pharmacy’s list price of the drug. Besides Costco, which has admirably set its list price quite low, the rest of these pharmacies have their list price set between $10k and $11k.
So you may be wondering … where the heck does this “est. retail price” number come from? You also may be wondering why is CVS’ list price nearly double this?!
Let’s take the second question first. The answer is 🤦♂️.
But this will make more sense after we answer the first question:
As we have been harping on since Day 1 here, all generic distortion roads lead back to Average Wholesale Price (AWP). Well, the average AWP for a 30 count of the 400 mg strength of Gleevec is just north of $9,200 right now. It’s not a coincidence that GoodRx list prices are around this. Pharmacies tend to bill a number resembling AWP +/- 10-20% (or apparently sometimes AWP +/- 100%?? 🤦♂️) just in case there is a payer out there that will, for whatever reason, pay a sum of money approaching this stratospheric number. And this happens … not often, but it does happen. In an era of downward reimbursement pressures, the business of pharmacy cannot afford to to miss out on getting paid thousands of dollars for something that costs a few hundred even if it only happens once in a blue moon.
So, what happens if the pharmacy doesn’t bill a high number? Well, that means it is killing any chance of ever getting a crazy high reimbursement. A pharmacy will at most get paid what it bills. So by setting a low list price, the pharmacy is, in effect, shredding its imatinib lotto ticket and tossing it in the trash. Now this is only one very small example, but kudos to Costco for setting its imatinib list price so low, despite our U.S. pharmacy benefits system sending it the incentive to do exactly the opposite.
Here’s some more insight we can glean from these GoodRx pricing sheets. Let’s just for argument sake all agree that the “est. list price” is, at most pharmacies, a proxy for AWP. Recall that most payers are buying generic drugs at some discount to their AWP. This means that if you use your insurance, the fully-loaded price (shared by you and your employer) is a discount to some price that looks like GoodRx’s left column (est. list price). Meanwhile, if you just pay cash for the drug based on an actual competitive market price, you get the price on the right, but without some luck and legwork, it doesn’t count towards your deductible. Typically an 85% discount to list price (a very aggressive generic guarantee for an employer nowadays) would be a great deal, right? But when the list price is around $10k (and almost surely guaranteed to never change) and the real price is less than $200 (and falling), it doesn’t seem like such a great deal anymore.
Only in health care can an 85% off blowout sale!!! 🎈🎉🎆 be a horrible deal.
Here’s what’s even more depressing. Maybe you have a very kind employer that only makes you pay a small co-pay for imatinib. They still will get stuck with an inflated bill for the drug. And then guess what happens next year when they need to renew the company’s health insurance coverage? Their premiums go up, and sadly, no matter how much they love you, they will eventually be forced to pass at least a portion of that cost burden onto you. This means you can’t completely hide from bloated drug list prices. One way or another they will sneak into your pocket and steal your money - whether it’s directly through drug purchases this year, or higher premiums next year.
This is all a huge mess. If you’ve been following along over the past 20 months, you already know that. But we can do something about this. Get educated on what drugs really cost (GoodRx is a great resource to find both the “wrong” and the “right” costs) and ask questions of your pharmacist, doctor, PBM, insurer, and employer when things don’t make sense. Ask them about the crazy list prices and then challenge them when they calmly quote you numbers exceeding your mortgage. Our collective education can change this system for the better by forcing those responsible for providing you with your healthcare coverage to answer these really uncomfortable questions.
6. Generic Zomig (zolmitriptan) prices get slashed in half
Generic Zomig (zolmitriptan) is an anti-migraine medication in the class of drugs most often referred to as Triptans. Triptans are considered first-line treatment of moderate to severe migraine, or mild attacks that have not responded to nonprescription medicines. In the United States there are currently seven available Triptans with zolmitriptan representing the third to come to market back in 1997. In February 2020, the cost of generic zolmitriptan 2.5 and 5 mg tablets dropped by 78% and 55%, respectively, as shown in Figure 7.
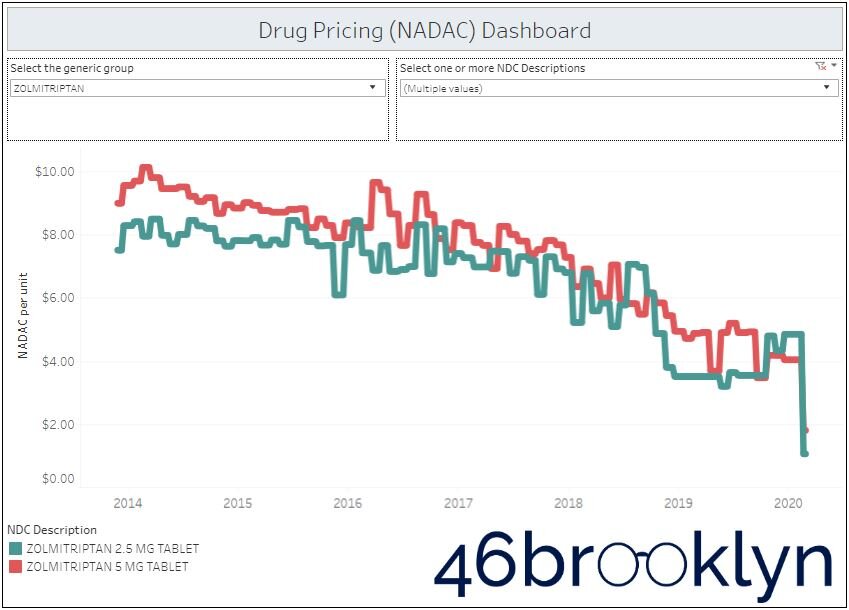
Figure 7
Source: Data.Medicaid.gov, 46brooklyn Research
To put the decline into perspective we took all oral Triptan tablets and rank ordered them by their average NADAC per unit across all available strengths. As shown in the table below, zolmitriptan is now the third cheapest Triptan (on average) behind summatriptan (generic for Imitrex) and rizatriptan (generic for Maxalt).

Figure 8
Source: Data.Medicaid.gov, 46brooklyn Research
Oh how wonderful would it be if physicians and patients had easy access to this sort of information! Ideally, we long for a world where patients are badgering doctors for the clinical rationale for prescribing the costly frovatriptan over the much less expensive sumatriptan - presumably with an ICER report in hand. But sadly, we live in a world of hidden prices and uneducated consumers making decisions using largely other people’s money (i.e. taxpayers). Exactly the way the supply chain wants it to be.
Changing this may be impossible, but we gotta start somewhere. May as well be here; may as well be now.
What are you seeing?
While we spend more time than we’d like to admit studying the pricing changes during each NADAC Survey Results Week, we don’t always catch every story worth noting. Be sure to take a gander at all of our updated Visualizations that rely on NADAC prices. If you’re seeing any interesting movement on drugs, especially in a time of generic drug inflation and coronavirus-driven drug shortage concerns, let us know.