
PSA: Brand drug prices up; Generic prices down
The CLIFF NOTES
As a non-profit, we at 46brooklyn have made it our goal to provide insights into drug pricing data. Every month, we publish our public service announcement regarding the happenings with U.S. drug prices based upon the figures we’ve gathered over the prior month. And most months, the story is brand list prices going up (as measured by wholesale acquisition cost or WAC) and generic prices down (as measured by National Average Drug Acquisition Cost or NADAC), which one could argue is how the system is designed to work – the cost for new treatments being offset from the savings of older ones. This dynamic is no different in this month’s drug pricing report, as we observed $23 million in generic drug deflation last month and the most number of August brand list price increases since 2015. One of the dots we’ve perhaps failed to connect is why, despite the similarity in results seen each month, this PSA pricing update matters so much to us at 46brooklyn.
While list prices are important – with real consequences to what everyday people pay at the pharmacy counter – they are only part of the story as it relates to drug prices. This is because pharmacy prices are, generally speaking, governed by contract terms set by pharmacy benefit managers (PBMs). This is true whether you’re the payer of prescription drugs (i.e., health plans / patients), the provider of those same drugs (i.e., pharmacies), or the manufacturer of those drugs. All these entities in some way shape or form have their prices influenced by PBM contracts and pricing terms. With that in mind, consider a few key facts about what we know about drug prices:
Brand medications represent less than 10% of utilization but greater than 80% of drug costs (consequently, they are the largest driver of drug expenditures to health plans)
The net price of brand medications is generally decreasing over time due to rebates, discounts, and other price concessions.
There is a direct relationship between a brand medication’s WAC price (which our tool tracks) and average wholesale price or AWP (thanks to AWP-based litigation in the early 2000’s).
PBMs generally offer their health plan clients a financial guarantee for discounts off the average wholesale price (AWP) of branded medications.
What this means is that if you’re a health plan or plan sponsor, and you’ve signed a PBM contract for services, the value that you’re getting over time with your AWP-based financial guarantee is decreasing over time because AWP is increasing over time. Perhaps even more so this year than in year’s past, as we’ve seen the largest growth in the number of brand list price changes in nearly three years (and brands are likely the largest contributor of your overall expenses). Bear in mind that many PBM contracts with drug manufacturers include inflationary rebates, meaning the PBM receives inflation protection in the form of rebates for these price increases. This in turn means that the net price is unchanged from the PBM perspective post-price increase because the rebate amount grew.
Fortunately, most PBM contracts include a market check clause, allowing a health plan to investigate whether it is still getting a good deal on its services in the middle of its contract term. And that is one of the reason’s we provide this PSA each month. While those market checks can have their own limitations that we could spend months explaining, they are certainly better than nothing and definitely worth seeing through. Absent the drug pricing distortions that exist, we know that in the aggregate, PBM contracts with drug manufacturers have provisions to attempt to keep brand drug pricing inflation down via rebates. We also know that the net prices of generics is going down over time (see our YoY NADAC deflation tracker later in this report). What this means is that if you find yourself paying more for the same drug from your PBM this year than you were paying last year, consider this your sign that it may be worth investigating why that is the case.
So as the feds continue their tangled, multidirectional attempts at drug pricing reform, we again try to offer a bit of clarity and context to the discourse. Read on to arm yourselves with the details as it relates to August’s brand and generic drug pricing changes.
Brand Name Medications
1. A high number of list price increases for brand drugs
There were a total of 43 brand-name medications that saw WAC price increases in August, which are all featured and contextualized in our Brand Drug List Price Change Box Score.
Price increases this month ranged from 1.5% to 32.1% (no, that is not a typo) and impacted $750 million in prior year gross Medicaid expenditures (a number about half that of last month’s $1.5 billion). As a reminder, brand price increases in Medicaid are largely held in check thanks to the Medicaid Drug Rebate Program (MDRP), which includes rebate penalties for drug price increases. This is one of a number of reasons that solely analyzing brand list price changes provides an incomplete picture of what’s really happening with brand manufacturer economics, thanks to the growing lot of opaque rebates, discounts, and giveaways that drugmakers shave off those list prices. But alas, until PBMs, insurers, and rebate aggregators make more granular data on net prices public, we’ll continue working with what we’ve got.
2. Brand price trends over time
To help contextualize brand name drug list price increase behavior, we find it beneficial to review past trends. In comparison to prior years, this past month saw the most August branded price increases since 2015, when there were 65 products with a list price increase (Figure 1).

Figure 1
Source: 46brooklyn Research, derived from Elsevier Gold Standard Drug Database (GSDD) on 9/8/2021
If past indicators are any predictor of future performance (which they’re not, but we can’t help ourselves), next month will likely be a slow month in terms of the number of price increases with an uptick in October (grey bars above) and then again in December (light blue bars above). We remain on track to be very close to matching the total number of brand price increases in 2021 as were observed in all of 2018 (as a reminder, we’ve already exceeded 2020 and 2019 annual totals).
While the number of price increases are up this month, when further examining our brand drug box score visualization, we continue to see the degree of increases at some of the lowest levels in recent history. Of the drugs that took increases so far this year, the median price increase has been 4.8% – the lowest percentage in over a decade. And when weighting the list price increases using Medicaid drug utilization data, 2021’s brand increases amount to a weighted average of 3.8%, which is a rounding error away from the smallest degree of increases in over a decade as well.
3. Brand drug list price changes worth taking note of in July
Because of the large number of list price increases this month, we will spare you and ourselves from reviewing each of them individually as we’ve done in past months. That said, there are certainly a few worth taking a moment to specifically review:
Neulasta (pegfilgrastim), a medication which helps grow certain kinds of blood cells – generally administered after certain cancer medications are given – took a 3% list price increase, impacting $200 million dollars in prior year gross Medicaid spend. Neulasta is particularly interesting because a biosimilar, which in effect would represent generic competition for this drug, was approved late in 2019 but has still not actually launched on the market (meaning Neulasta is still a captured market with no real competition).
Otezla (apremilast), an oral medication used to treat certain kinds of psoriasis, took a 2.4% increase, impacting ~$65 million in prior year gross Medicaid spend. Note this represents the second time this year Amgen has taken a list price increase on Otezla with the first occurring way back in week 4 (January 22) at 7.4%.
Emflaza (deflazacort), a steroid for the treatment of Duchenne muscular dystrophy (DMD), took a 4% list price increase, impacting $63 million dollars in prior year gross Medicaid spend. Emflaza is interesting because while it is relatively new to the U.S., it has been approved and used in European countries for years and available at a significant discount there (roughly 90%) – another stark example of pricing differentials between the United States and other countries.
Natacyn (natamycin), a eye drop used to treat fungal infections, saw a 32% list price increase. This price increase impacts less then $1 million in prior year Medicaid expenditures and is interesting simply because it is the largest percentage price increase this month.
The other brand list price increases worth talking about are actually a collection of products from Merck & Company. Merck raised the price of all 11 vaccines within their portfolio on August 12th, which we should note was also flagged by Bernstein analysts last month. Price increases ranged anywhere from a 2.9% to 6%. Combined, these price increases impact at least $150 million in prior year gross Medicaid expenditures (we say ‘at least’ because these are generally administered on the medical benefit and not as pharmacy claims, meaning our data underestimates the extent of impact of these price increases). Being vaccines, they are not traditional drugs; so the impact of these WAC price increases may be felt more directly and less prone to rebate offsets. For example, vaccines are generally not a covered outpatient drug and thus not part of the Medicaid Drug Rebate Program (MDRP), meaning Medicaid isn’t as insulated from these price increases. This is the same rationale for why vaccines do not have price points in the NADAC survey.
Given what we’ve learned – and are continuing to learn – about the importance of vaccines as preventative medicine with COVID-19, these price increases are certainly noteworthy. And on that front, it’s worth adding that we’ve given an estimated 5.71 billion COVID vaccines globally this year. We know there have been shortages of vaccine components as we’ve ramped up to give these extra vaccines, and it is therefore possible Merck’s price increases represent increased demand for the component parts to make their vaccines. But given that this is drug pricing, the transparency about why a pricing action is taken will likely elude us, so we can only speculate. Regardless, if the increases are related to broader vaccine supply chain pressures, it could be an omen for vaccine price increases from other manufacturers in the near future as well.
Generic Medications
4. A favorable unweighted price change picture
Each month, we look at how many generic drugs went up and down in the latest month’s survey of retail pharmacy acquisition costs (based on National Average Drug Acquisition Cost, NADAC), and compare that to the prior month (Figure 2).
Basically, the quick way to read Figure 2 is to look for blue bars that are taller than orange bars to the left of the dotted line, and exactly the opposite to the right of the dotted line. That would indicate a good month – more generic drugs going down in price compared to the prior month, and less drug prices going up.
Figure 2
Source: Data.Medicaid.gov, 46brooklyn Research
Great news! That’s what happened this month. For every generic drug that increased in price this month, 1.21 decreased in price. That’s a welcome change contrast from last month, where that same ratio was a 0.87. The story gets better when drilling into the double-digit price moves – this month, there were 32% more drugs that decreased in price (vs. last month) by 10% or more, and 11% fewer drugs that increased in price (again, vs. last month) by 10% or more.
But as usual, take this unweighted price change analysis with a grain of salt. To really make heads or tails of all of these pricing changes, let’s weight these changes.
5. Weighted Medicaid generic deflation comes in at $23 million
The purpose of our NADAC Change Packed Bubble Chart (Figure 3) is to apply utilization (drug mix) to each month’s NADAC price changes to better assess the impact. We use Medicaid’s 2020 drug mix from CMS to arrive at an estimate of the total dollar impact of the latest NADAC pricing update. This helps quantify what should be the real affect of those price changes from a payer’s perspective (in our case Medicaid; individual results will vary).
The green bubbles on the right of the Bubble Chart viz (screenshot below in Figure 3) are the generic drugs that experienced a price decline (i.e. got cheaper) in the latest survey, while the yellow/orange/red bubbles on the left are those drugs that experienced a price increase. The size of each bubble represents the dollar impact of the drug on state Medicaid programs, based on utilization of the drugs in the most recent trailing 12-month period (i.e. bigger bubbles represent more spending). Stated differently, we simply multiply the latest survey price changes by aggregate drug utilization in Medicaid over the past full year, add up all the bubbles, and get the total inflation/deflation impact of the survey changes.

Figure 3
Source: Data.Medicaid.gov, 46brooklyn Research
Overall, in August, there was $99 million worth of inflationary drugs, offset by $122 million of deflationary generic drugs, netting out to $23 million of deflation for Medicaid, reversing out most of last month’s $39 million in inflation.
6. Year-over-year generic oral solid deflation inches up to 15.5%
Ever since June 2020, we have been tracking year-over-year generic deflation for all generic drugs that have a NADAC price. We once again weight all price changes using Medicaid’s drug utilization data. This month, deflation on oral solid generics and all generics crept up to 15.5% and 11.8%, respectively (Figure 4). If you are a purchaser of generic drugs, these numbers going up is good as it means costs are going down (deflating).
Figure 4
Source: Data.Medicaid.gov, 46brooklyn Research
7. Top/notable generic drug decreases this month
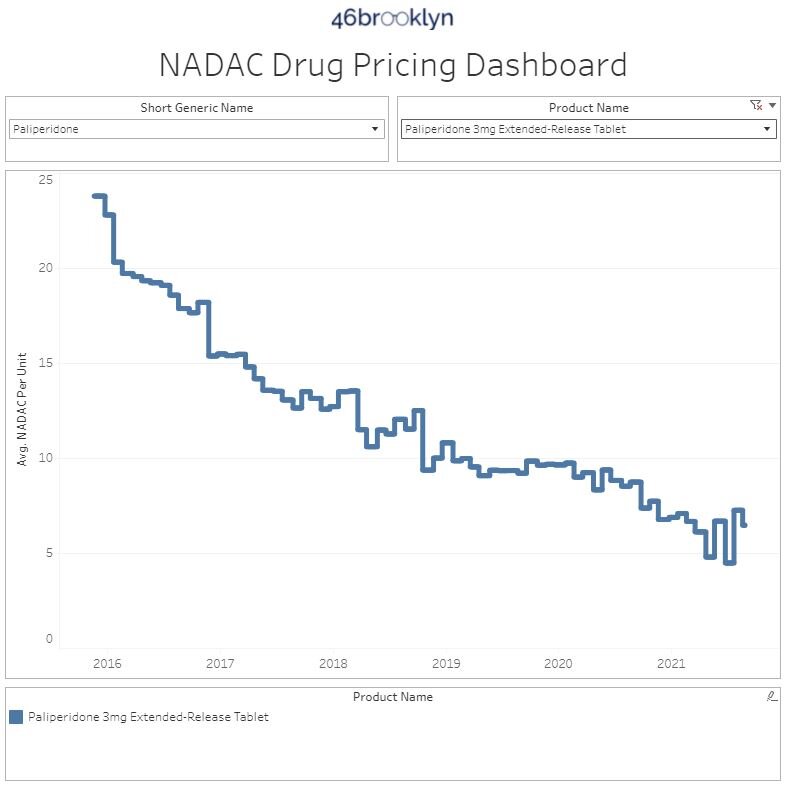
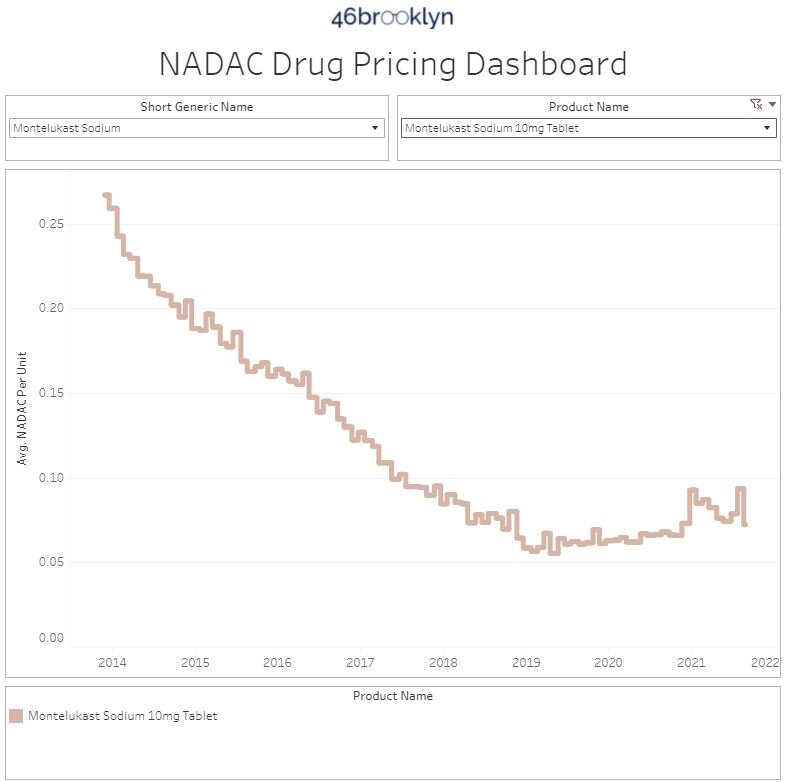
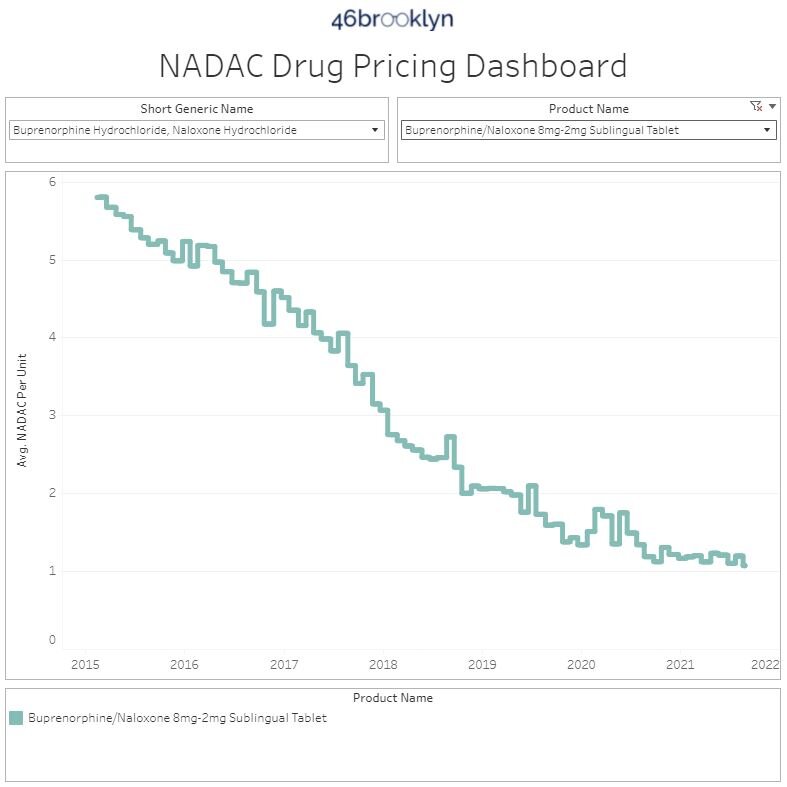
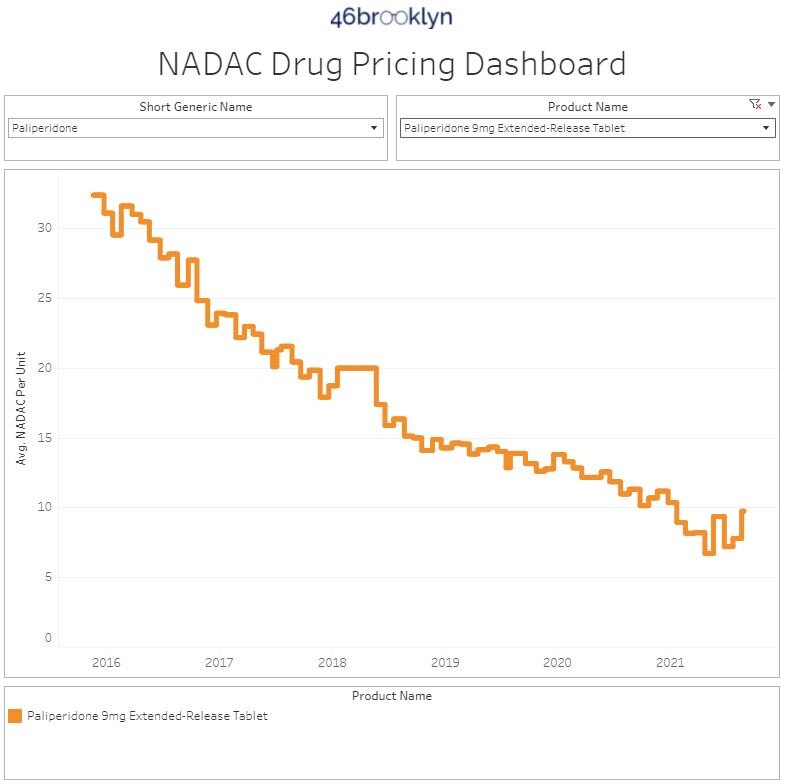
There are several generic drug price decreases worth noting this month. The most interesting, at least in our opinion, are paliperidone ER 3 mg tablet (10.9% decrease on 2.1 million doses), montelukast 10mg tablet (22.7% decrease on 193 million doses), and buprenorphine-naloxone 8-2mg tablet (10.3% decrease on 57.9 million doses). These are particularly notable because all three of these medications were highlighted as price increases last month and have more or less settled to where they were demonstrating just how temperamental the generic marketplace can be.
8. Top/notable generic drug increases
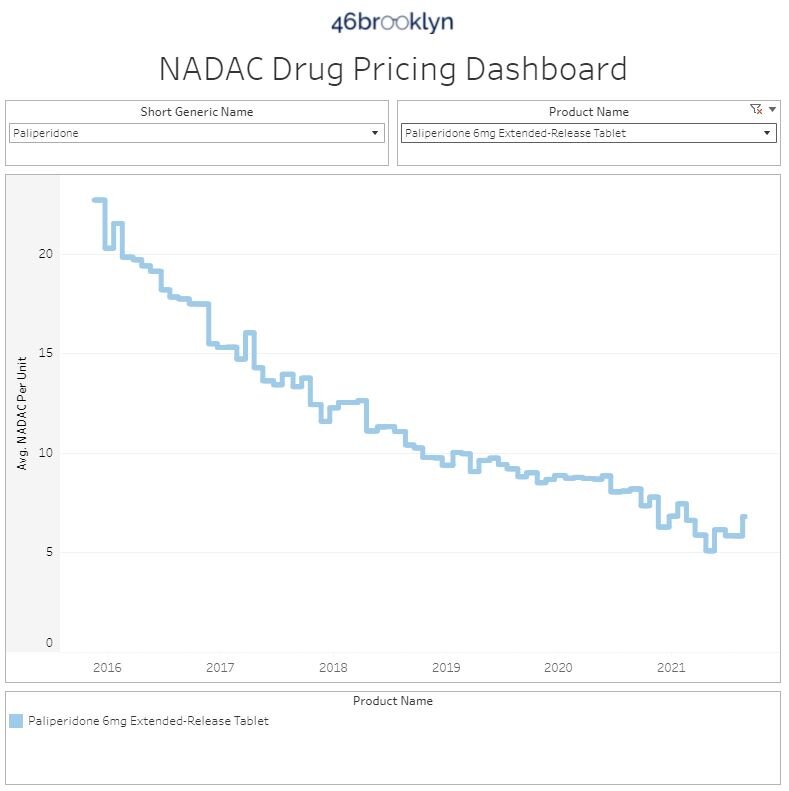
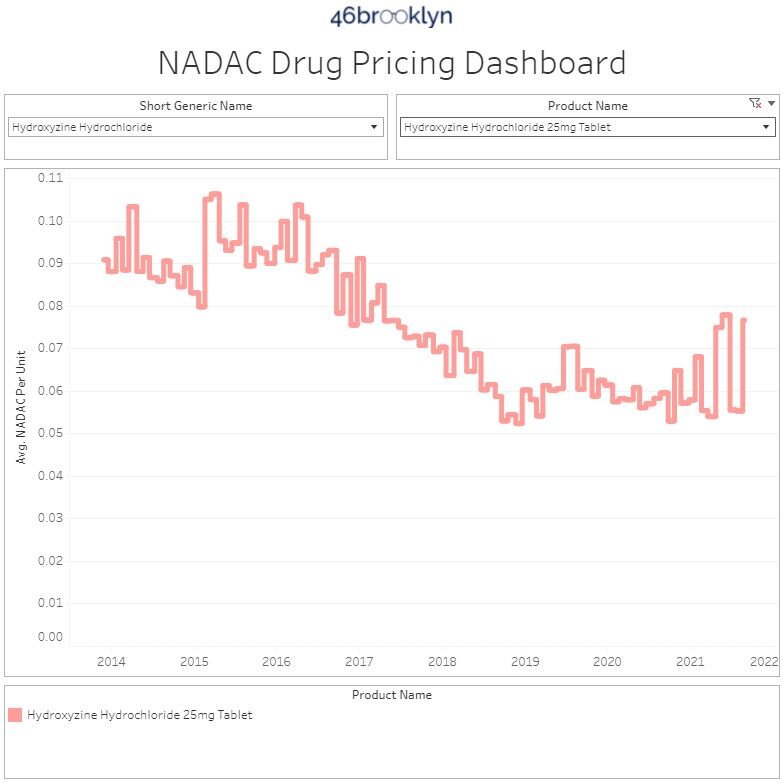
On the increase side of things, the most impactful increases were paliperidone ER 6 mg tablets (16.6% increase on 3.9 million doses), paliperidone ER 9 mg tablets (25.1% increase on 1.6 million doses), and hydroxyzine HCL 25mg tablet (38.7% increase on 148 million doses).
Thanks to Susan Heavey and Carl O’Donnell at Reuters, and Kelly Hayes at KTVU FOX for featuring our January report on brand drug list price increases in their recent pieces on federal efforts to compress prescription drug prices.
Additional thanks to Alana Hippensteele at Pharmacy Times for an interview and discussion with 46brooklyn CEO Antonio Ciaccia on US drug pricing distortions.
Check out the “Tony and Tony” episode of the Independent Pharmacy Alliance Podcast, featuring Ciaccia and IPA’s Anthony Reznik discussing some of the backwards dynamics and conflicts of interest in the drug supply chain that unnecessarily inflate the costs of medicine.
Shout-out to Gaby Galvin at Morning Consult for including us in her report on state efforts to bring accountability to the PBM industry as a means to eliminate wasteful spending on prescription drugs.
Thanks to Jake Zuckerman at the Ohio Capital Journal for chatting with us on insulin list prices, as new legislation has been introduced in Ohio seeking to cap inflated out-of-pocket expenditures for patients.
Lastly, thanks to the folks at Business Insider for recognizing Antonio Ciaccia as one of their 30 Leaders Under 40 Changing Healthcare, and much appreciation to Insider’s Shelby Livingston for her great write-up on our work.