We were wrong about generic Revlimid. The problem is worse than we thought.
Checking the math on our Past report
To say tackling prescription drug costs is a challenge would be a massive understatement. As we have documented for many years, getting a good deal on prescription drugs can seem like a constant game of cat and mouse.
That is especially true for “specialty drugs,” which is the catch-all term essentially used to describe the super expensive or complex medicines. This “special” class of drugs is generally known for driving half of prescription drug expenditures despite accounting for less than 2% of overall pharmacy claims.
While what is and isn’t a specialty drug can be arguably just as confusing as anything else in healthcare, as the most expensive bucket of medicines, they command special attention for patients and plan sponsors struggling to afford them.
And when it comes to prescription drug affordability, perhaps nothing is more important for payers than capitalizing on the benefits that competition can yield to bring down the costs of medicines. While nothing is simple in healthcare, we think most would understand the basics of the drug channel: the patent exclusivity afforded to brand drugs is going to typically result in high prices. However, once brand, generic, and biosimilar competition takes root in a drug class, similarly situated medicines will face pressure to lower their costs. For the most part, that’s exactly what happens — that is, until the prescription drug supply chain hides and withholds the benefits of competition-driven deflation.
Nowhere is this problem more prominent in the world of specialty drugs. The bigger the price tag for the drug, the bigger the financial risk can be for overpaying.
In our last “Wrecklimid” report, which was one of our longest ever, we examined another prolific instance where the fruits of market competition were being deprived from patients and plan sponsors. And for long-time followers of our work, it should come as no surprise that “special” cancer medications are yet again at the forefront of drug pricing dysfunction.
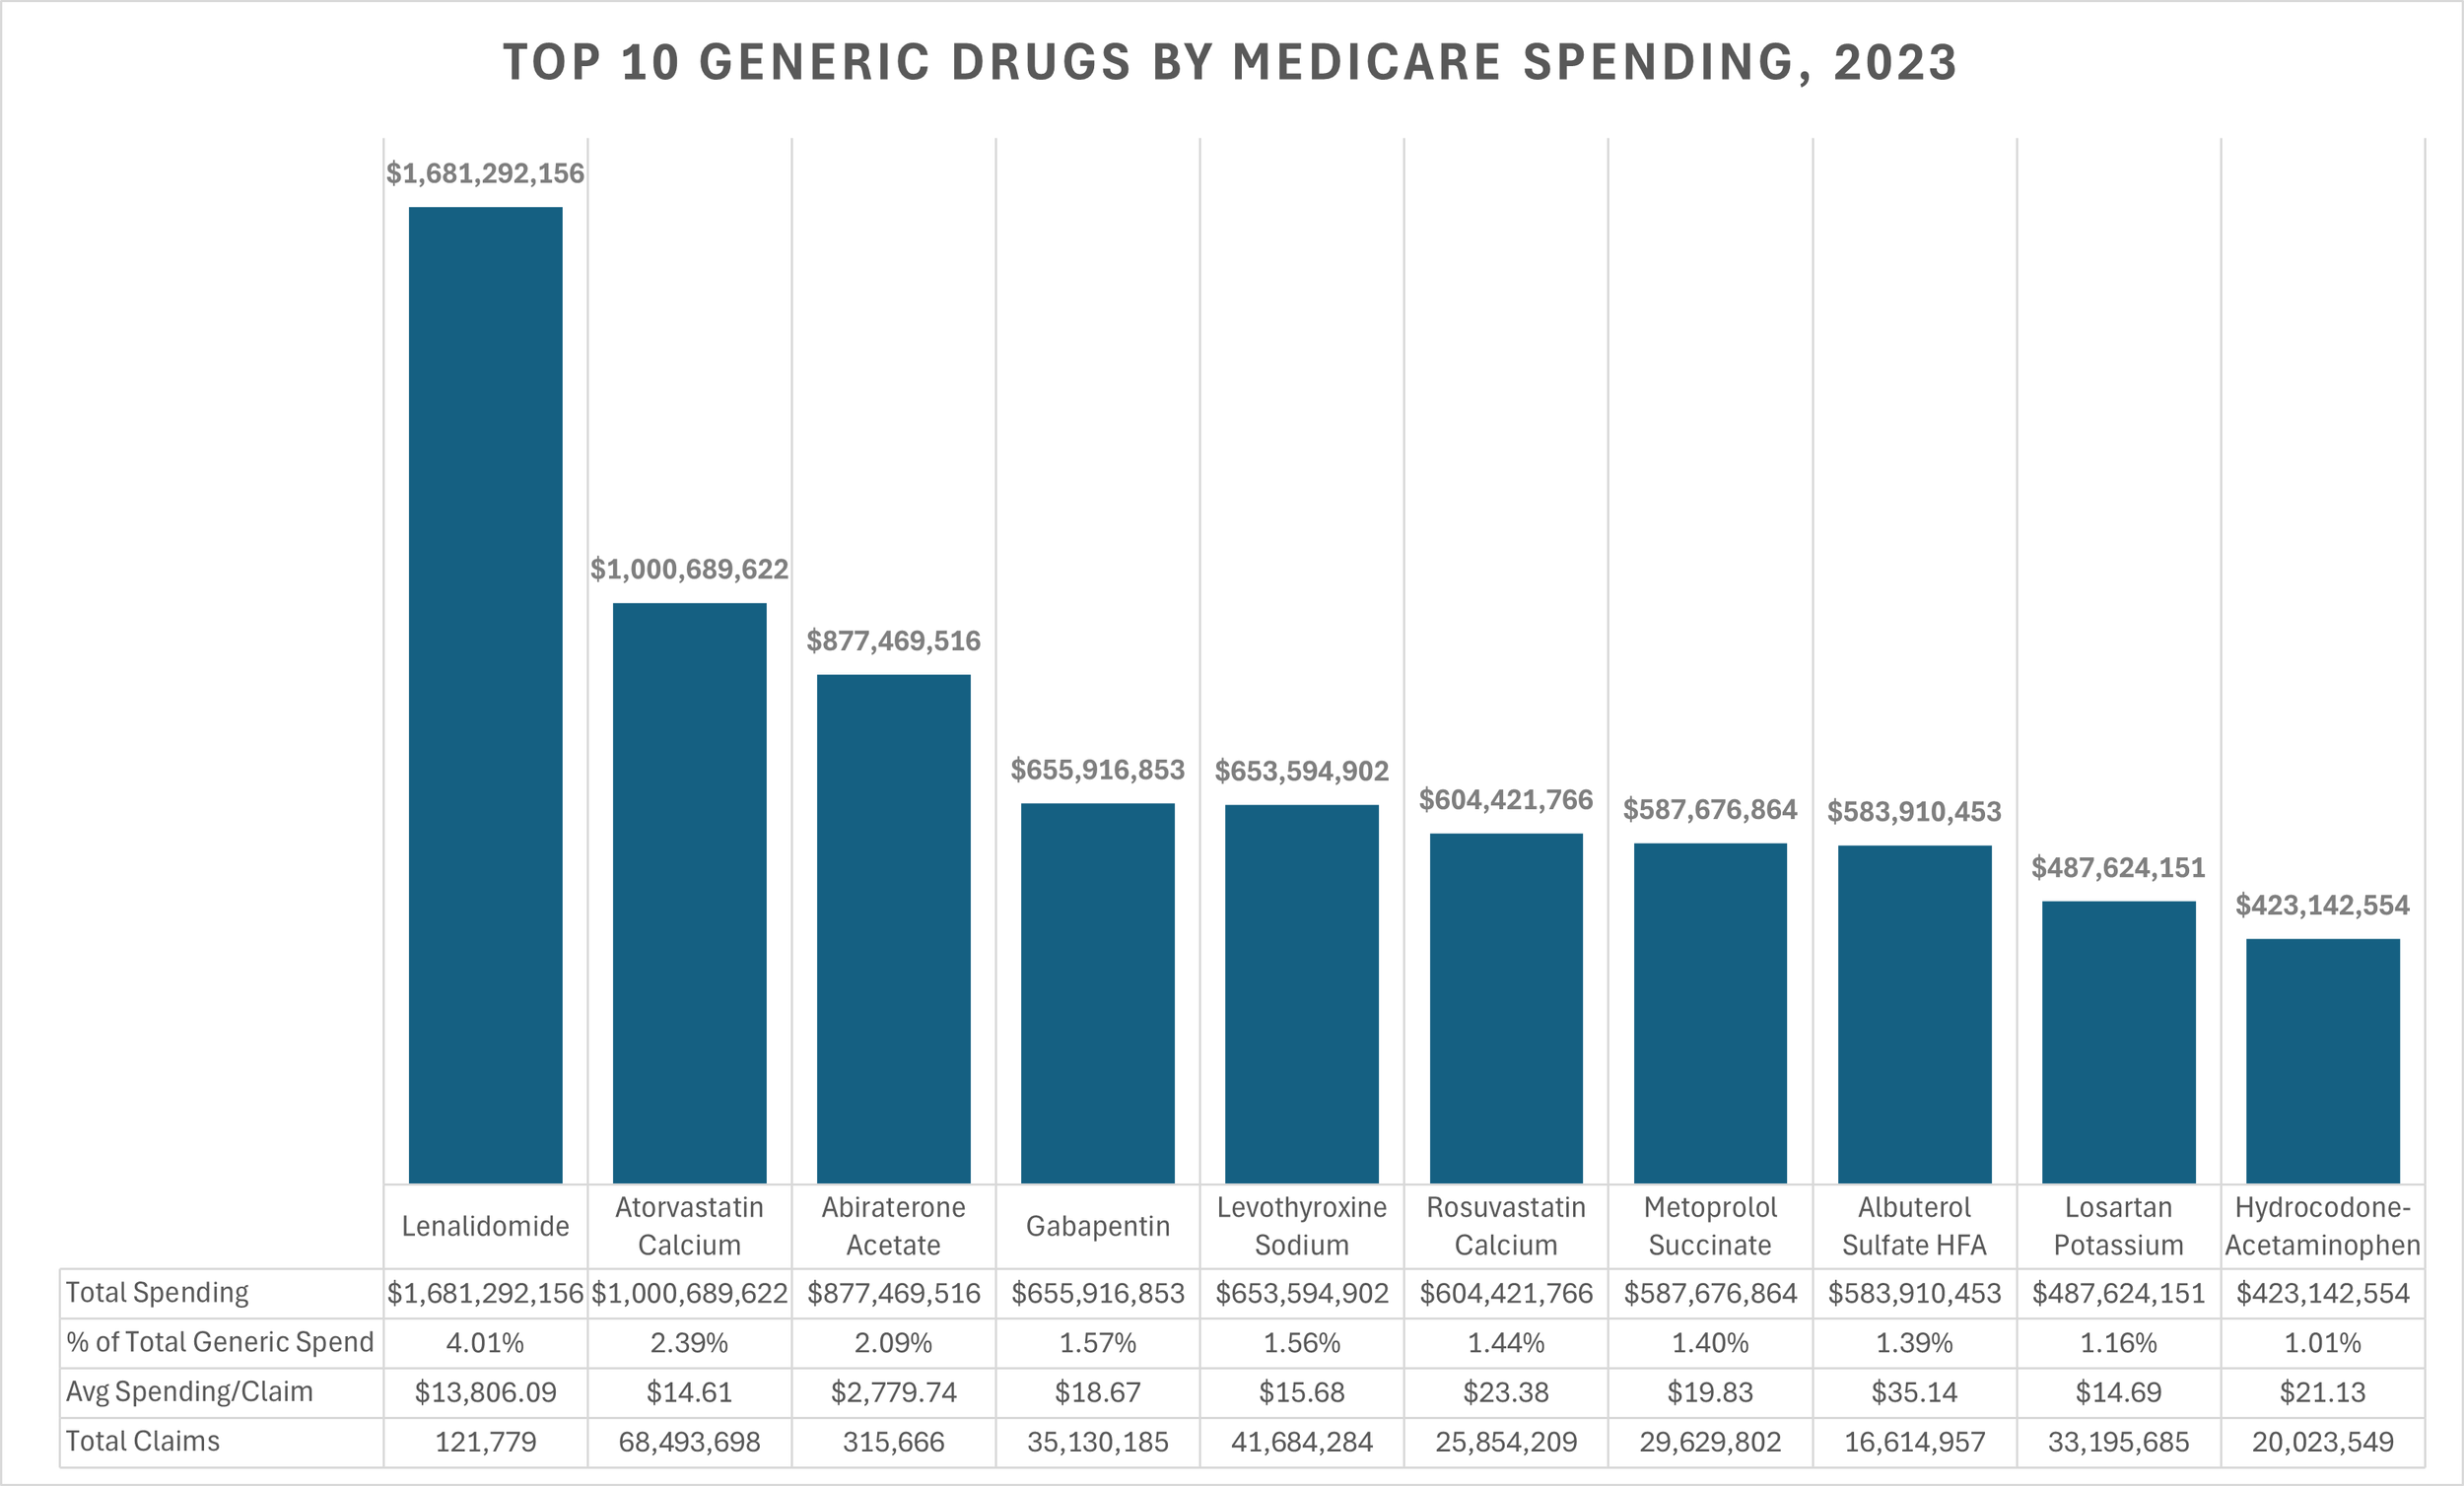
Figure 1
Source: Medicare Part D Dashboard
Much like our very first report in 2018 examined the pricing distortions for the popular specialty drug generic Gleevec (imatinib), our most recent analysis unpacked the similar distortions we found for generic Zytiga (abiraterone) and used those learnings to forecast the road ahead for Medicare’s most expensive generic drug, Revlimid (lenalidomide). In that recent Wrecklimid report, we dissected the Medicare Part D market to see how a generic drug like lenalidomide — despite being used by a relatively small number of patients — could be associated with more spending than some of the most expensive brand drugs in the country (lenalidomide was ranked as the 29th most expensive drug in Medicare in 2023).
At the time we composed our Wrecklimid report, we only had data through 2023; so we made some estimates about what the “future” would look like.
Of course, “the future” being 2024 through 2026 meant that whatever was going to happen had already happened, but we just didn’t know what actually happened because the data wasn’t available to us yet (we’re pretty sure this sentence makes sense, but if you’re not following, we basically made predications about 2024 and 2025 that were only predications because the data wasn’t available yet). Recently, we discovered CMS Part D data that gives us the ability to check our predictions. So we set out to see just how accurate our original lenalidomide forecast was (in relation to what CMS actually bought during 2024 and 2025). If you recall from our original Wrecklimid report, we projected that despite a likely decline in drug cost from generic competition, Medicare Part D spending on generic Revlimid (lenalidomide) would have risen to $3.5B in 2025, up from $1.7B in 2023 — more than doubling in just two years.
So how did we do?
The short answer is: our model was directionally right, but still too low. In other words, Medicare spending on generic Revlimid number got bigger, but we underestimated just how much bigger. Let’s sort through the wreckage.
Checking our work
As stated above, the goal of today’s analysis is to simply look at whether our prior estimate on generic Revlimid spending in Medicare Part D holds up once more recent Medicare data became available.
A normal generic should become cheaper, and more broadly accessible, as competition within the prescription market builds. A decade-old study from IQVIA gives us a good idea of just how much cheaper a drug can get once the brand patent exclusivity times out. As you can see in Figure 1 below, IQVIA tells us that generic drugs can be expected to deflate by 66% in just three years. Those numbers are even better for oral medications, where deflation rates can average 77% over that same window.
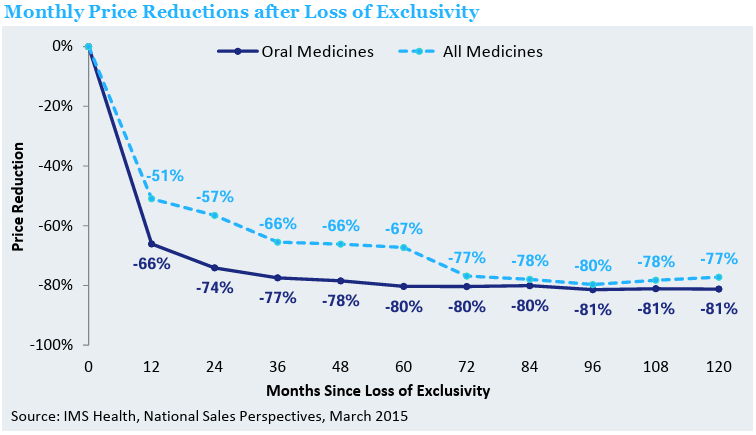
Figure 2
Source: IQVIA
For existing generic drugs, our monthly 46brooklyn reports (coming back soon, we swear) shows year-over-year oral solid deflation at around 10%.
So you get the idea. With BMS losing patent exclusivity for Revlimid in 2022, even with the more limited phasing-in of generic competition, we should expect much lower costs by 2025.
But Revlimid (lenalidomide) did not behave like a normal generic (Medicare spends more on it than many brand-name therapies, even though it is generic) as we saw in our Wrecklimid piece. We found that Revlimid stayed concentrated in a narrow dispensing network, and that rather than deflating, we actually saw costs increase in Medicare. In a generic market that is supposed to push unit costs down, this result defied expectations.
In our earlier Wrecklimid piece, we used the limited data available to predict that if the trend was followed forward, Medicare would spend more than $5.7 billion in two years ($2.17B in 2024, $3.53B in 2025).
So imagine our surprise when we discovered that CMS released a Quarterly Part D Spending by Drug database that offers a more up-to-date view of spending than the Yearly version. Stitching together data from both the quarterly and yearly databases, we were able to check our predicted spending on generic Revlimid against Medicare’s actual experience for 2024 and 2025. As shown in Figure 3 below, when we look at what Medicare actually spent vs. what we thought they’d spend, we got the correct decimal place at the billion level, but missed hundreds of millions of dollars in actual Medicare Part D drug spend. In fact, we undershot the spending projection by $870 million, meaning the lenalidomide markup issue is likely worse than we thought.
| Year | Modeled Part D Spending | Reported Part D Spending | Difference vs. Model | Difference % |
|---|---|---|---|---|
| 2024 | $2.17B | $2.64B | +$0.47B | +21.7% |
| 2025 | $3.53B | $3.93B | +$0.40B | +11.2% |
While our napkin math missed the mark on spending by 10%+ in 2025 and 20%+ in 2024, it should not be lost on the reader that any projected increase at all on this drug over two years would defy conventional expectations. And as you can see above, expecting the unexpected was the right directional shot, but that would be selling it short.
Recall from the earlier Wrecklimid report that 2023 Part D spending for lenalidomide was $1.68 billion – making it the most expensive generic drug in the program. The new CMS data shows that rather than lenalidomide costs deflating by 60-70% over the next two years, instead we saw the costs inflate by 134%.
In what should have been a deflationary environment, the Part D expenditures for lenalidomide more than doubled.
How can this be?
Loyal 46brooklyn readers likely know how this plot unfolds – a broader market distortion we’ve been talking about ever since we launched in 2018. When a generic drug can be called “special,” the value proposition of the product can become fundamentally disconnected from what the market might otherwise do to pressure price. And we’ve struggled to find a rational explanation for why beyond the dynamics of the role of PBMs and specialty pharmacies within the drug channel.
How different lenalidomide is from the rest of the generic market
To see how unusual lenalidomide is, it helps to compare it directly to the rest of the top-10 generic market for Part D in 2025 (which we can now do thanks to the new data; see Figure 4 below).
| Rank | Product | 2025 Part D Spending | Share of Generic Part D Spending |
|---|---|---|---|
| 1 | Lenalidomide | $3.93B | 10.8% |
| 2 | Atorvastatin Calcium | $0.82B | 2.3% |
| 3 | Abiraterone Acetate | $0.60B | 1.7% |
| 4 | Gabapentin | $0.56B | 1.6% |
| 5 | Albuterol Sulfate HFA | $0.52B | 1.4% |
| 6 | Rosuvastatin Calcium | $0.48B | 1.3% |
| 7 | Cyclosporine | $0.46B | 1.3% |
| 8 | Metoprolol Succinate | $0.45B | 1.2% |
| 9 | Levothyroxine Sodium | $0.45B | 1.2% |
| 10 | Hydrocodone-Acetaminophen | $0.44B | 1.2% |
As shown in Figure 4, lenalidomide is the largest generic drug by overall spending in 2025, and it is not even close. It was more than 4.8-times larger in its spend than the next-biggest generic (atorvastatin) in the top 10 despite being used by less than 1% of Medicare Part D members. Atorvastatin, in contrast, is used by about one in three Medicare members, but is associated with a quarter of the spending of lenalidomide. By the time you whittle the generic drug market to the top 10 drugs, lenalidomide is still standing far apart from the rest of the field.
Consider looking at Figure 4 from a slightly different perspective, and you’ll see that roughly $1 out of every $10 dollars spent across the entire generic market in Medicare went to lenalidomide, while the rest of the top-10 peers were clustered far below it. Also recognize that roughly nine out of every ten prescriptions dispensed is a generic drug (and broadly, non-lenalidomide generics). That scale is immensely unbalanced, particularly if all that revenue is going through a limited pharmacy channel – a pharmacy channel that is proportionally heavily reliant on generic drug margins.
In other words, the issue was not a small modeling error. It was a structural mismatch between a market that should be broad and competitive, and a drug that is still behaving like a tightly constrained specialty product.
Savings may be coming
This new CMS dataset gives us the ability to track Medicare drug spending more frequently than the historic Medicare Part D dashboard, but even so, data for the later half of 2026 is not readily available. So we wait to see when the efficiencies of generic competition move from theory to reality.
In the meantime, we know from the drug labelers making lenalidomide that they generally cannot agree on what the list price of the product is. One labeler has set their wholesale acquisition cost (WAC) price at about a 20% discount to brand Revlimid; whereas two others have set their WAC price at a 99% discount tot he brand. And yet even for these heavily discounted labelers, one’s WAC price is approximately half the WAC price of the other (i.e., $6 per pill vs. $12 per pill). This kind of pricing concealment can be what happens when you take a $90K drug and discount it down that much; a 99% discount can hide significant differences in prices.
Nevertheless, some early signals exist that the actual cost of the drug is more competitive than the list price would suggest. When we look at state Medicaid prices (not NADAC, as the drug still doesn’t have a NADAC, but public state acquisition cost lists or maximum allowable cost lists), we see unit prices as low as approximately $4 per pill in places like Oregon, Alabama, Utah, and Colorado (in July 2026) and as high as approximately $150 per pill in places like Kentucky (also July 2026). Whether the supply chain agrees that the drug should be treated as a cheap generic or an expensive specialty drug will likely have big implications for the spending on this medication going forward.
What to watch next
So where does that leave us? The practical takeaway is straightforward. If the policy debate assumes generic drugs automatically become cheap once exclusivity ends, lenalidomide is a reminder that channel design matters just as much as brand vs. generic status. And so long as we ignore the impact that factors beyond a drug manufacturer’s list price have on influencing the actual dollars and cents paid for prescription drugs, we’re likely to still encounter challenges modeling just what the future holds.
The Government Accountability Office (GAO) seemingly tried to give some insights on some of these dynamics in its recently released a surface-level accounting of payments between pharmacies and vertically integrated plan sponsors, but its lack of granularity and disregard for actual financial yields in the net demonstrate that the real causes of our drug affordability issues are far more nuanced than we give them credit for.
Meanwhile, it’s sick patients like Jen Holifield who are left with the hefty price tag of treatment while “the system” continues its current auto-pilot.
Maybe the answers continue to evade us because the questions we are asking continue to miss the real target. Or maybe the target keeps finding ways to evade the hit. But fear not; data transparency is the ultimate equalizer, and we have much more to uncover and teach. We came here to chew bubblegum and expose drug pricing truths, and we’re all out of bubblegum.