Wrecklimid: How treating generic drugs as something special can wreck affordability
In late 2025, the Congressional Budget Office (CBO) issued an unusual request – a call for new research into Medicare Part D spending. The request stemmed from CBO’s own observations regarding Part D spending, which showed that federal spending on the Medicare Part D benefit, which covers prescription drugs sold in retail settings, will increase much more in 2026 than CBO and others previously projected. According to CBO, recent Medicare Part D plan bids imply cost increases that existing models cannot adequately explain, raising the prospect of hundreds of billions of dollars ($500 billion to be specific) in additional federal spending over the next decade. Such a discrepancy suggests not merely higher utilization or incremental price increases, but the presence of deeper structural distortions within Medicare’s drug pricing framework.

Source: Magical Quote
Now, today’s latest 46brooklyn drug pricing deep-dive is something we were working on before CBO’s request (yes, that means we’ve been working on it for awhile), but we nevertheless feel it’s worthwhile to highlight CBO’s request for information at the start; not because we think this report will meet CBO’s needs (we’re not really analyzing behavioral responses to caps on out-of-pocket spending, analysis of changes in benefit designs of Part D plans and enrollees' responses to those changes, and analysis of market-wide trends in spending on prescription drugs or what CBO’s announcement specifically requested). Rather, we’re analyzing a familiar plot unfolding in our convoluted drug channel – we’ve captured it before in our Copaxone and Tecfidera works.
Today, we will dig into how the drugs that are supposed to be cheap contribute to the bloated prescription drug costs for Medicare and beyond. And what, as we see it, makes those cheap generic drugs so expensive is the fact that they are special.
While the details matter, and we encourage you to make your way through the report in its entirety, for a one-pager on this report’s findings, click here.
What makes specialty drugs so special?
Specialty drugs are the boogey-men of modern pharmacy spending. Representing approximately half of all drug expenditures but less than a few percentage points of utilization, thousands of articles, research papers, and blog posts can be found which discuss the role specialty drugs have on overall drug spending. However, if you dig deeper, you will discover that we do not actually agree on what is and isn’t a specialty medication. Back in 2023, we did a large write-up on what differences exist in the definitions of specialty drugs between the big 3 pharmacy benefit managers (PBMs) and found that not only do PBMs not agree on which drugs are specialty a good amount of the time, but they also seemingly include what would otherwise be generic drugs as part of their specialty drug lists. And while you may think 2023 was a lifetime ago, in checking back on this, we see that a slew of generic drugs still make up CVS’ specialty drug list (118 by our count), Express Scripts has at least dozens (though their lists don’t even seem to agree internally | list 1 | list 2), and there are hundreds of drugs flagged by UnitedHealthcare’s AARP Medicare Formulary for 2026 as being both generic and specialty (Figure 1 [Tier 5: Specialty Tier includes generic drugs] & Figure 2 [A generic drug is assigned to a Medicare Tier 5 status]):
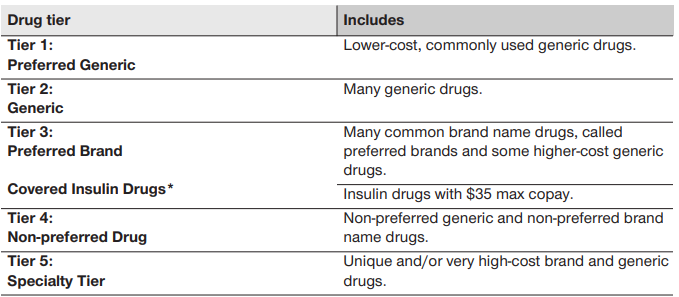
Figure 1
Source: United Healthcare’s AARP Medicare Formulary for 2026

Figure 2
Source: United Healthcare’s AARP Medicare Formulary for 2026
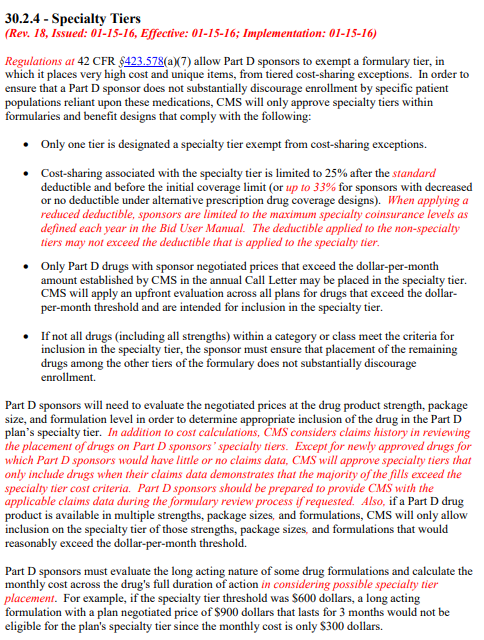
Now, part of the reason we cannot agree on what is or isn’t a specialty drug is there is no shared or universally applied definition. Medicare’s definition of what is and is not a specialty drug is amongst the most lacking definitions there is. Whereas most of the blog or research papers will say that a specialty drug is one that are high-cost, often requiring special handling, administration, monitoring or treat rare or uncommon disease states, Medicare effectively only defines specialty based upon the drug’s price (Figure 3 [only Part D drugs with sponsor negotiated prices that exceed the dollar-per-month amount … may be placed in the specialty tier]):
And in a world where there is little agreement on what a drug’s price ought to be — and wild disparity in how one drug can be priced across plans and pharmacies and regions — that is a dangerous way to define specialty drug.
Consider a drug like abiraterone, generic for Zytiga.
The CVS Specialty drug distribution list for 2026 shows that abiraterone is a specialty drug (Figure 4):
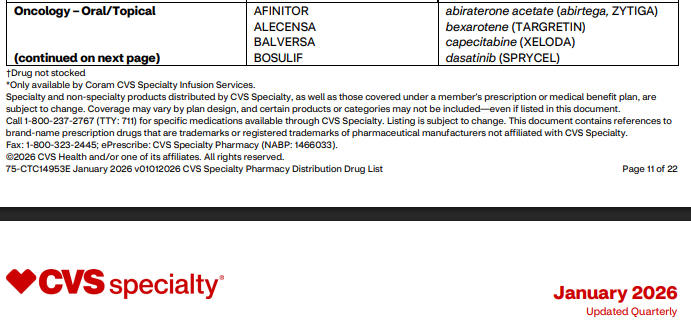
Figure 4
Source: CVS Specialty drug distribution list
And if we look into CVS specialty pricing, say through their program offered to State Farm employees, we can see the drug seems awfully close to a specialty drug by Medicare’s definition (Figure 5; almost a $1,000 for a month’s supply, and members get your wallets open, as you are expected pay $225.86 of that amount)
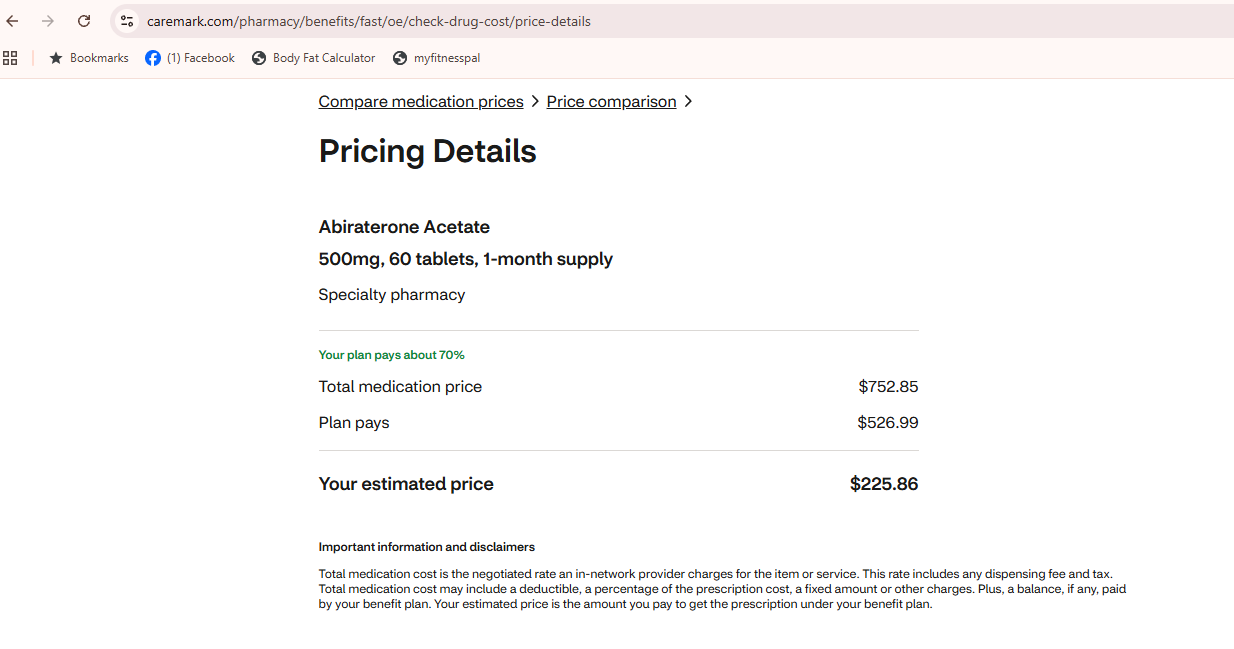
Figure 5
Source: CVS Pharmacy Benefits Price Comparison [Price pulled March 2026]
The Tricare specialty drug list shows that abiraterone is a specialty medication (Figure 6):

Figure 6
Source: Tricare specialty drug list
And again, if we look into Express Scripts pricing for Tricare members, abiraterone seems to be $12,411.20 (Figure 7)
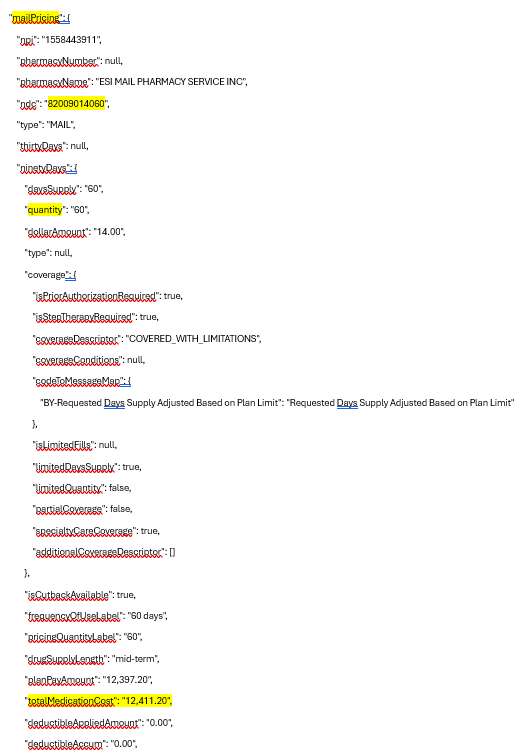
Figure 7
Source: Express Scripts Tricare Price A Medication [Note: NDC 82009014060 is abiraterone 500 mg; price pulled March 2026 but no longer appears available to pull]
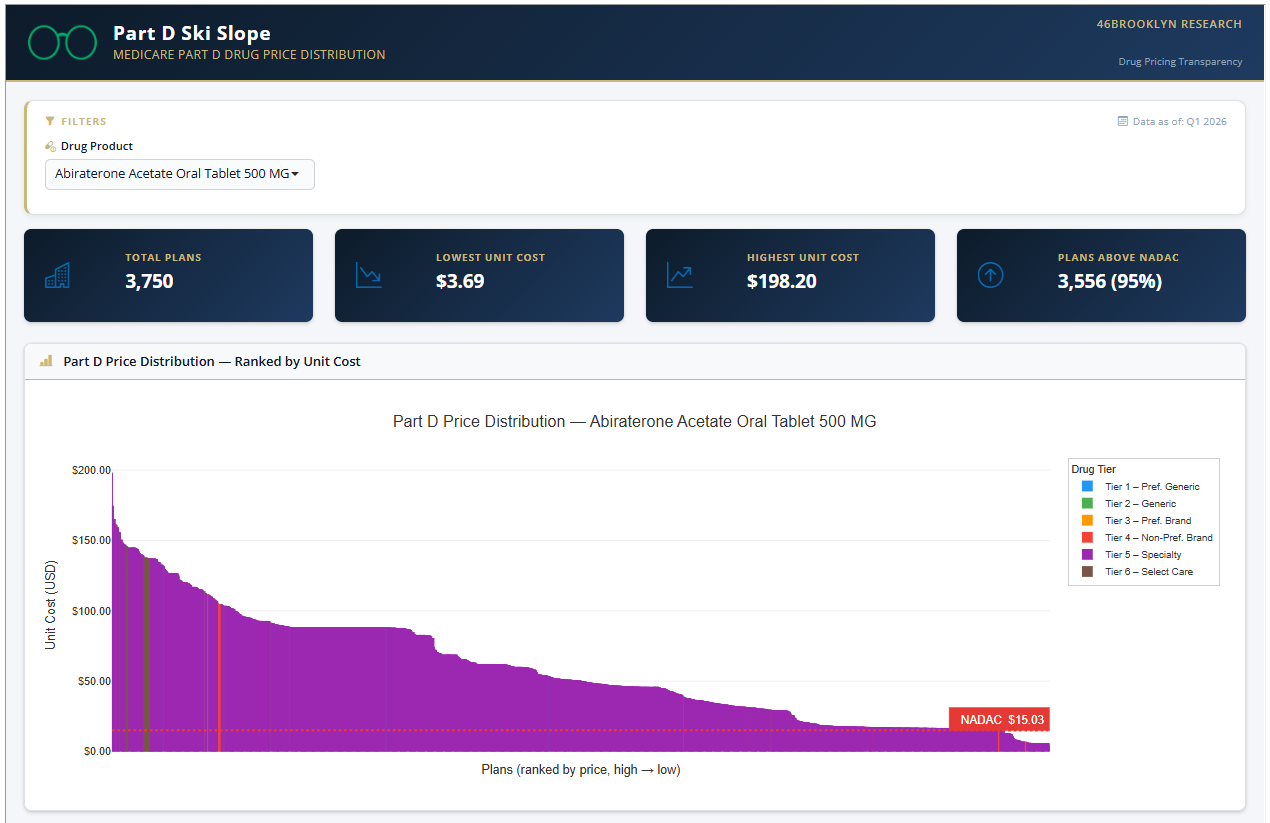
Whether this is real price to the government or not is difficult to say (we guess it’s possible that Express Scripts’ own pricing data isn’t actually accurate, which would certainly be something), but in some ways, that is a demonstration of the problem with drug pricing — namely, few know what the prices actually are, and even when you can see a price, you have little confidence if that price is the final, end-all-be-all price or if it will be modified or retrospectively reset. According to our own Medicare Ski-Slope dashboard embedded below, the $12K price tag is not outside the realm of possibilities though. In looking at that dashboard, the upper end price reported is $198.20 per pill (or approximately $12k for 60 tablets):
Speaking of Medicare, the Medicare AARP formulary for 2026 (via their PBM Optum [or the last of the Big 3 PBMs to look at]) gives us a signal that abiraterone is probably a specialty drug (indicating it has an average monthly cost of ~$950) (Figure 8 [only one of the two strengths is actually tier 5 - Specialty]):

Figure 8
Source: Medicare AARP formulary for 2026
Now fortunately we have been using abiraterone 500 mg, which means, when we look up this drug’s costs on the AARP Medicare plan drug cost estimator, we see that the cost of the drug certainly appears to meet Medicare’s specialty drug definition, as it is over $1,200 per month (with the member paying over $500 in the first month as they meet their deductible).
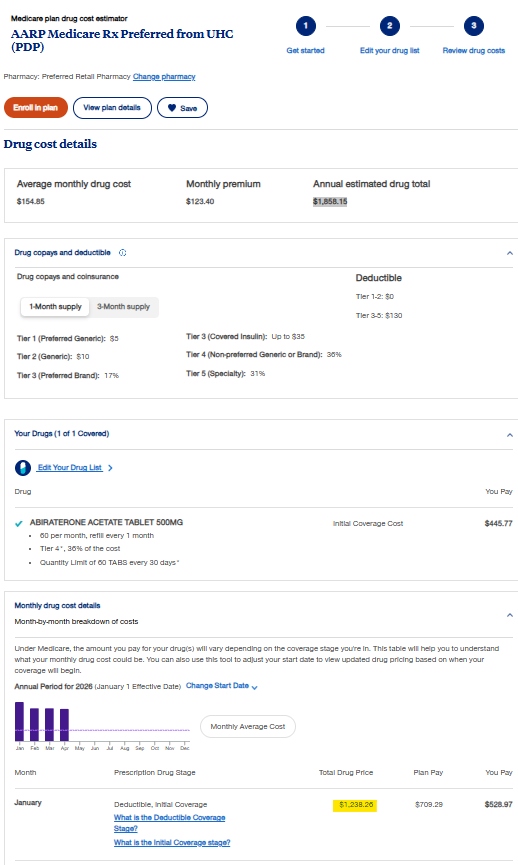
Figure 9
Source: AARP Medicare plan drug cost estimator
Isn’t that special?
It is worth taking a moment to review. CVS told us that the price of abiraterone 500 mg was approximately $750 (with the patient paying approximately $225), Express Scripts told us the price of the same drug was potentially even higher than that, and Optum told us the drug is approximately $1,200 (with the member paying approximately $525). And, well when there is such a variance in the high and low of these experiences (both in terms of overall drug costs and member cost share), all the costs seem to be sending a pretty obvious signal that this drug is special. (Cue the SNL Church Lady).
But outside of the big three PBMs at least agreeing that abiraterone is special (though the degree to which it is special is up to debate), we can’t help but wonder if they got it right. After all, when we review the PBM-to-plan sponsor contracts that are out there, most seem to give PBMs exclusive rights to define what is and isn’t special (Figure 10):
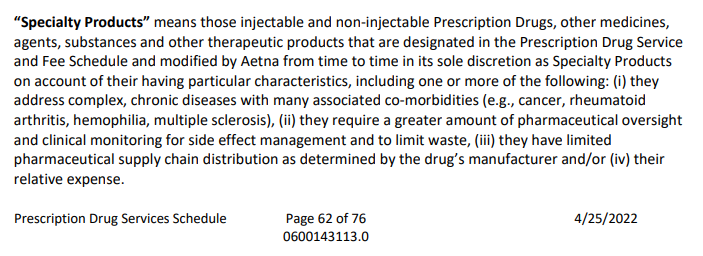
Now, we are nothing but humble drug pricing nerds, but we know of a variety of ways to look up drug prices; and given the range in abiraterone pricing through the big 3 PBMs, it seems worth double-checking their work. Said differently, a big difference in pricing is not a range we feel comfortable with, and probably not helpful to building good projections on pricing per CBO’s ask on understanding drug pricing trends that we led this report off with. When we look up abiraterone pricing with our pricing sources, we don’t see the drug as rising to CMS’ threshold of special.
For example, consider what national average drug acquisition cost, or NADAC, (or that survey of what pharmacies are actually paying to buy drugs from wholesalers based upon reviewed copies of their invoices by CMS), shows us about the drug’s price (Figure 11):
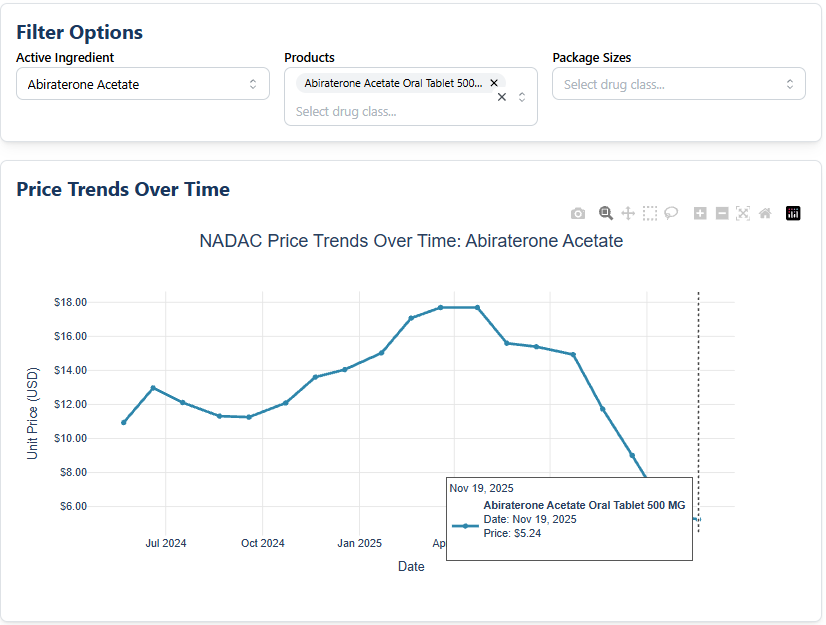
Figure 11
Source: Centers for Medicare & Medicaid Services NADAC
Now while our last observation for abiraterone 500 mg with NADAC is November 2025 (a little dated at the time we’re writing this, but that is the consequence of a voluntary survey), it wouldn’t appear to be special ($5.24 per pill X 60 pills of abiraterone 500 mg [the quantity used for all our big 3 PBM price comparisons] = $314.40). In fact, the math suggests it’s about a third of the price of Medicare’s specialty threshold even if we add on a $20 dispensing fee (about double the typical pharmacy cost to dispense, to reflect its “special” status).
Of course, we’re constantly learning about drug pricing, and so even though the trend of abiraterone pricing is showing it is cratering (Figure 11; see April 2025 to November 2025), maybe something happened in December 2025 or January 2026 that justifies the big prices we’re observing when we ask the big PBMs their pricing today (which, to be fair, is not their pricing in November 2025). So let’s ask some other data source what the price of abiraterone 500 mg is right now (in so far as right now is the time we pulled the numbers [January 26, 2026]).
According to Mark Cuban Cost Plus Drugs (note: 46brooklyn’s team works professionally at 3 Axis Advisors, where we perform data analytics work for Cost Plus Drugs), a month’s supply (60 pills) of abiraterone 500 mg can be purchased for under $100 (or one-tenth the Medicare specialty threshold rate in 2026 and maybe as much as one one-hundredth what some Medicare programs have to pay for the drug) (Figure 12):
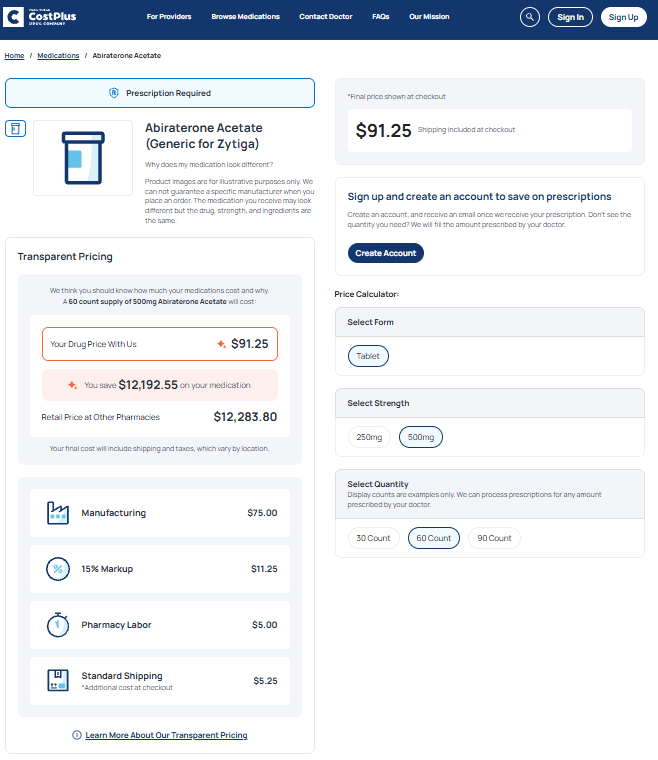
Figure 12
Source: Mark Cuban Cost Plus Drugs
Well isn’t that special?
Seems absurd to us that both NADAC and Cuban would appear to know more about abiraterone’s cost then the largest PBMs in the nation. Of course, PBMs are starting to point out that a lot of their legacy pricing models rely upon cross-subsidization (or someone paying more so that someone else pays less), so abiraterone likely represents just one of those high areas cross-subsidizing other low areas. Said differently, abiraterone might be a cherry we picked off their cherry tree.
But doesn’t that raise more questions than it answers – such as who and how is it decided who pays more and who pays less? Is it leverage – an employer with 100 covered lives gets worse pricing than an employer with 1,000 covered lives? Is that actually the PBMs using their leverage to negotiate better prices for us all or for themselves and their favorite clients? In University of Chicago’s Dr. Dennis Carlton report on PBMs, he points out that PBMs are able to use their leverage to negotiate better pricing than they would otherwise be able to do, but how does that square with the fact that not all PBM clients are getting the same prices? If the PBM has the leverage of all the plans it represents to negotiate with the pharmacies in its network, why, or how, does a PBM go about giving access to these various price points to its plan sponsor clients? Are we to believe that plan sponsors (directly or via their consultants) are electing to use the networks that pay worse rates rather than the networks that would result in them paying less? Dr. Carlton’s report specifically states, “One would expect lower cost or higher quality pharmacies to win preferred positions in pharmacy networks regardless of their status as independent or chain pharmacies, or PBM-affiliated or non-affiliated pharmacies,“ and yet Mark Cuban’s pharmacy offering doesn’t really have status with any of the big 3 PBM pharmacy networks. And we suspect that if you ask Mark, he’ll say he’s not sure why he’s not in either (as he seems to still be asking Optum for permission to be in their network).
So, with that in mind, let’s review Medicare drug spending and what medications like abiraterone (and its fellow “specialty” generic medications) can teach us about drug costs in Medicare in the future (after all, we want to try to explain why our past trends are not matching current expectations per CBO’s request). Our thesis, based upon our past work and this introduction, for this report is simple: when generic drugs are allowed to be categorized as specialty, assumptions of generic drug savings over time may be more blunted than typical modeling would suggest generic savings ought to be (which we have been saying since as long ago as 2018).
Be forewarned, this is a lengthy 46brooklyn piece (and that’s us saying it, so you know it’s going to be a doozy), so you may want to grab a drink (and your blood pressure medications if drug pricing distortions cause you distress).
Part D generic drug spending dynamics
According to the data, Medicare Part D drug spending has increased significantly over the last decade. CMS data show the gross average claim cost for Part D rose from $96.07 in 2015 to $170.57 in 2023 — a 77.5% increase over eight years (Figure 13).
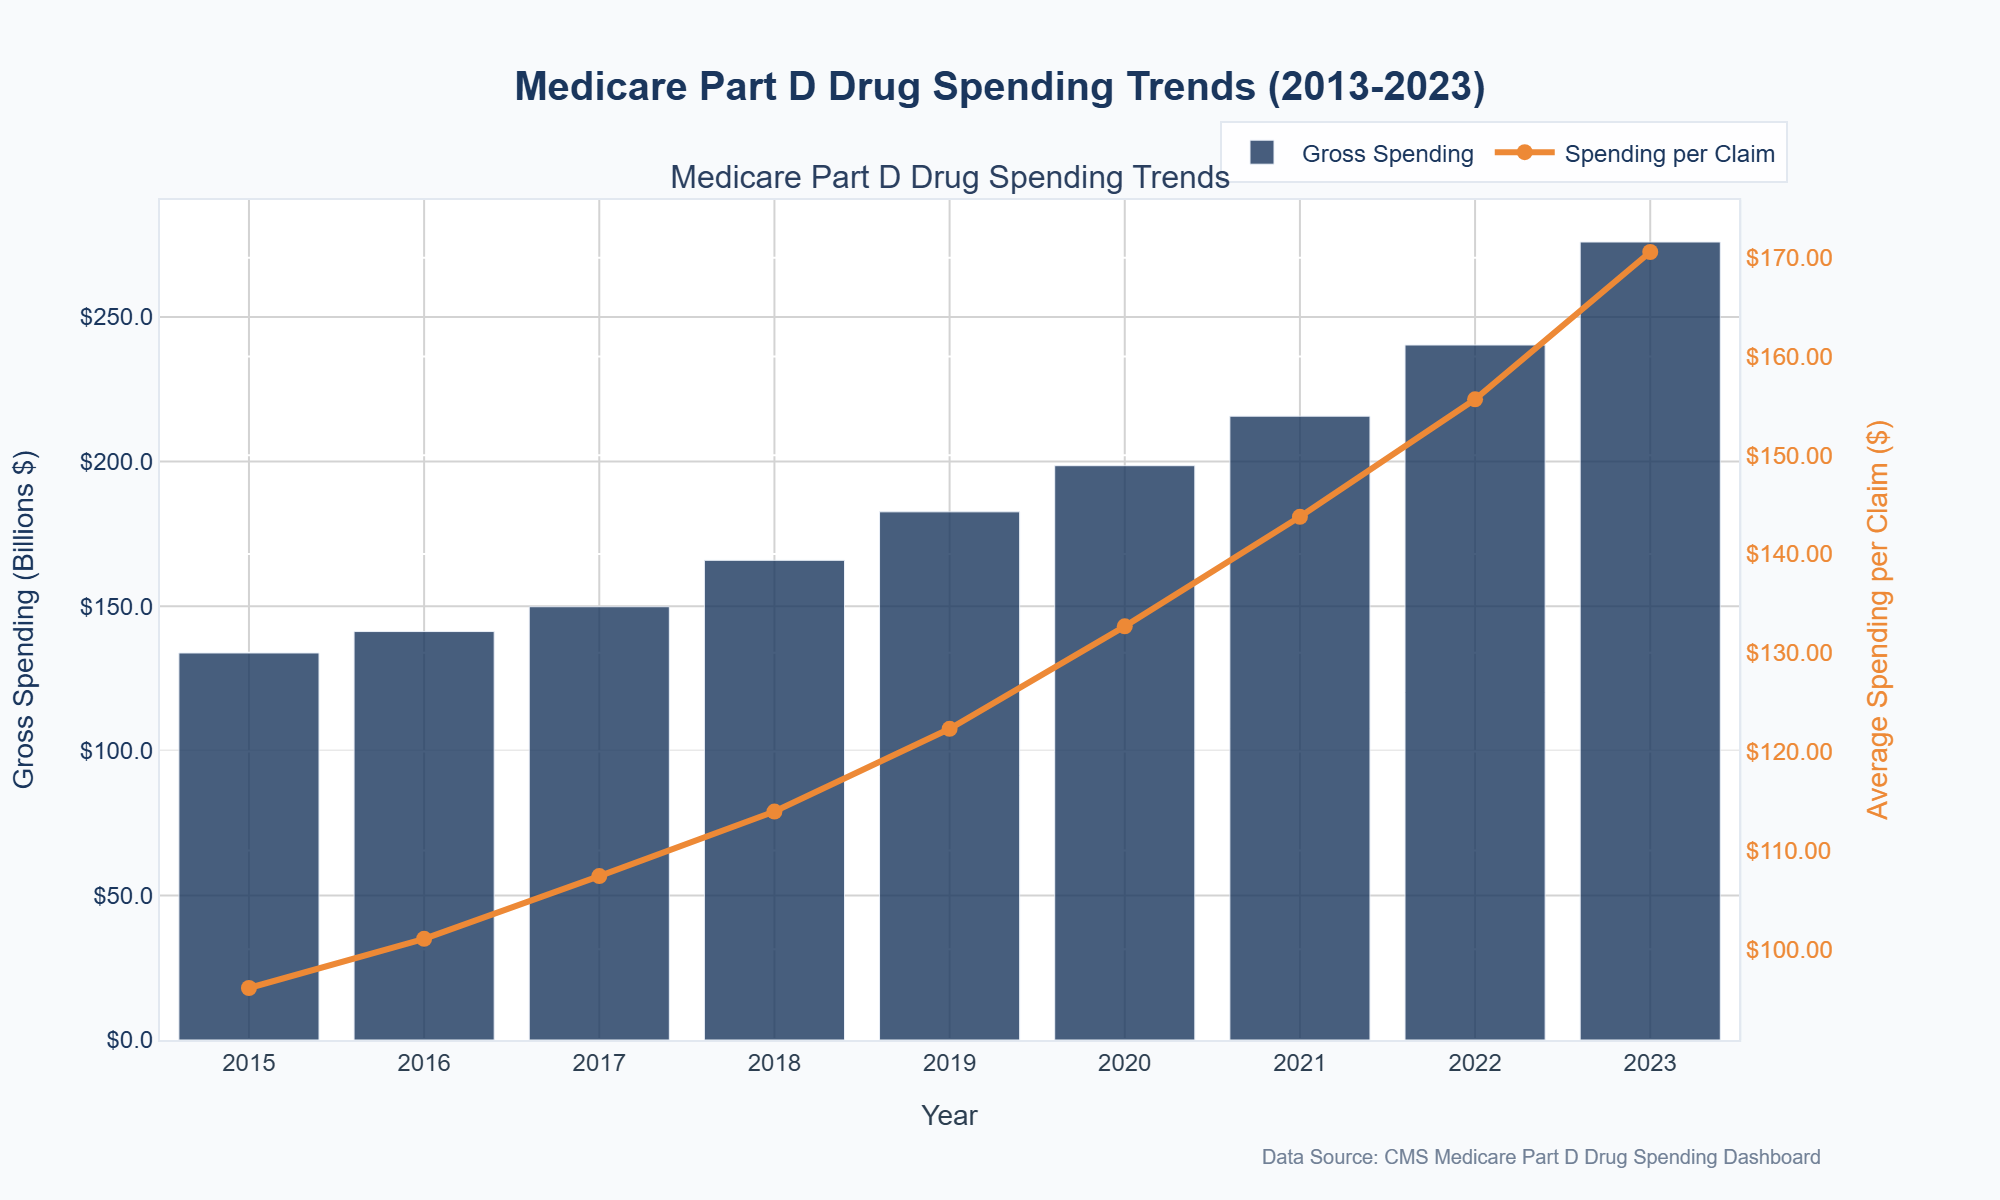
Figure 13
Source: Medicare Part D Dashboard
Multiple factors contribute to this increase, including the introduction of new high-cost specialty drugs, price hikes on existing medications, and the now-revised direct and indirect remuneration (DIR) fees (particularly as that may have masked cross-subsidization to a degree). Digging a little deeper into the data shows a typical culprit for the majority of prescription drug spending increase in Medicare — brand-name drugs. Between 2015 and 2023, average gross brand drug spending per prescription increased from $502.45 to $1,215.54 — a 141.8% increase (Figure 14):
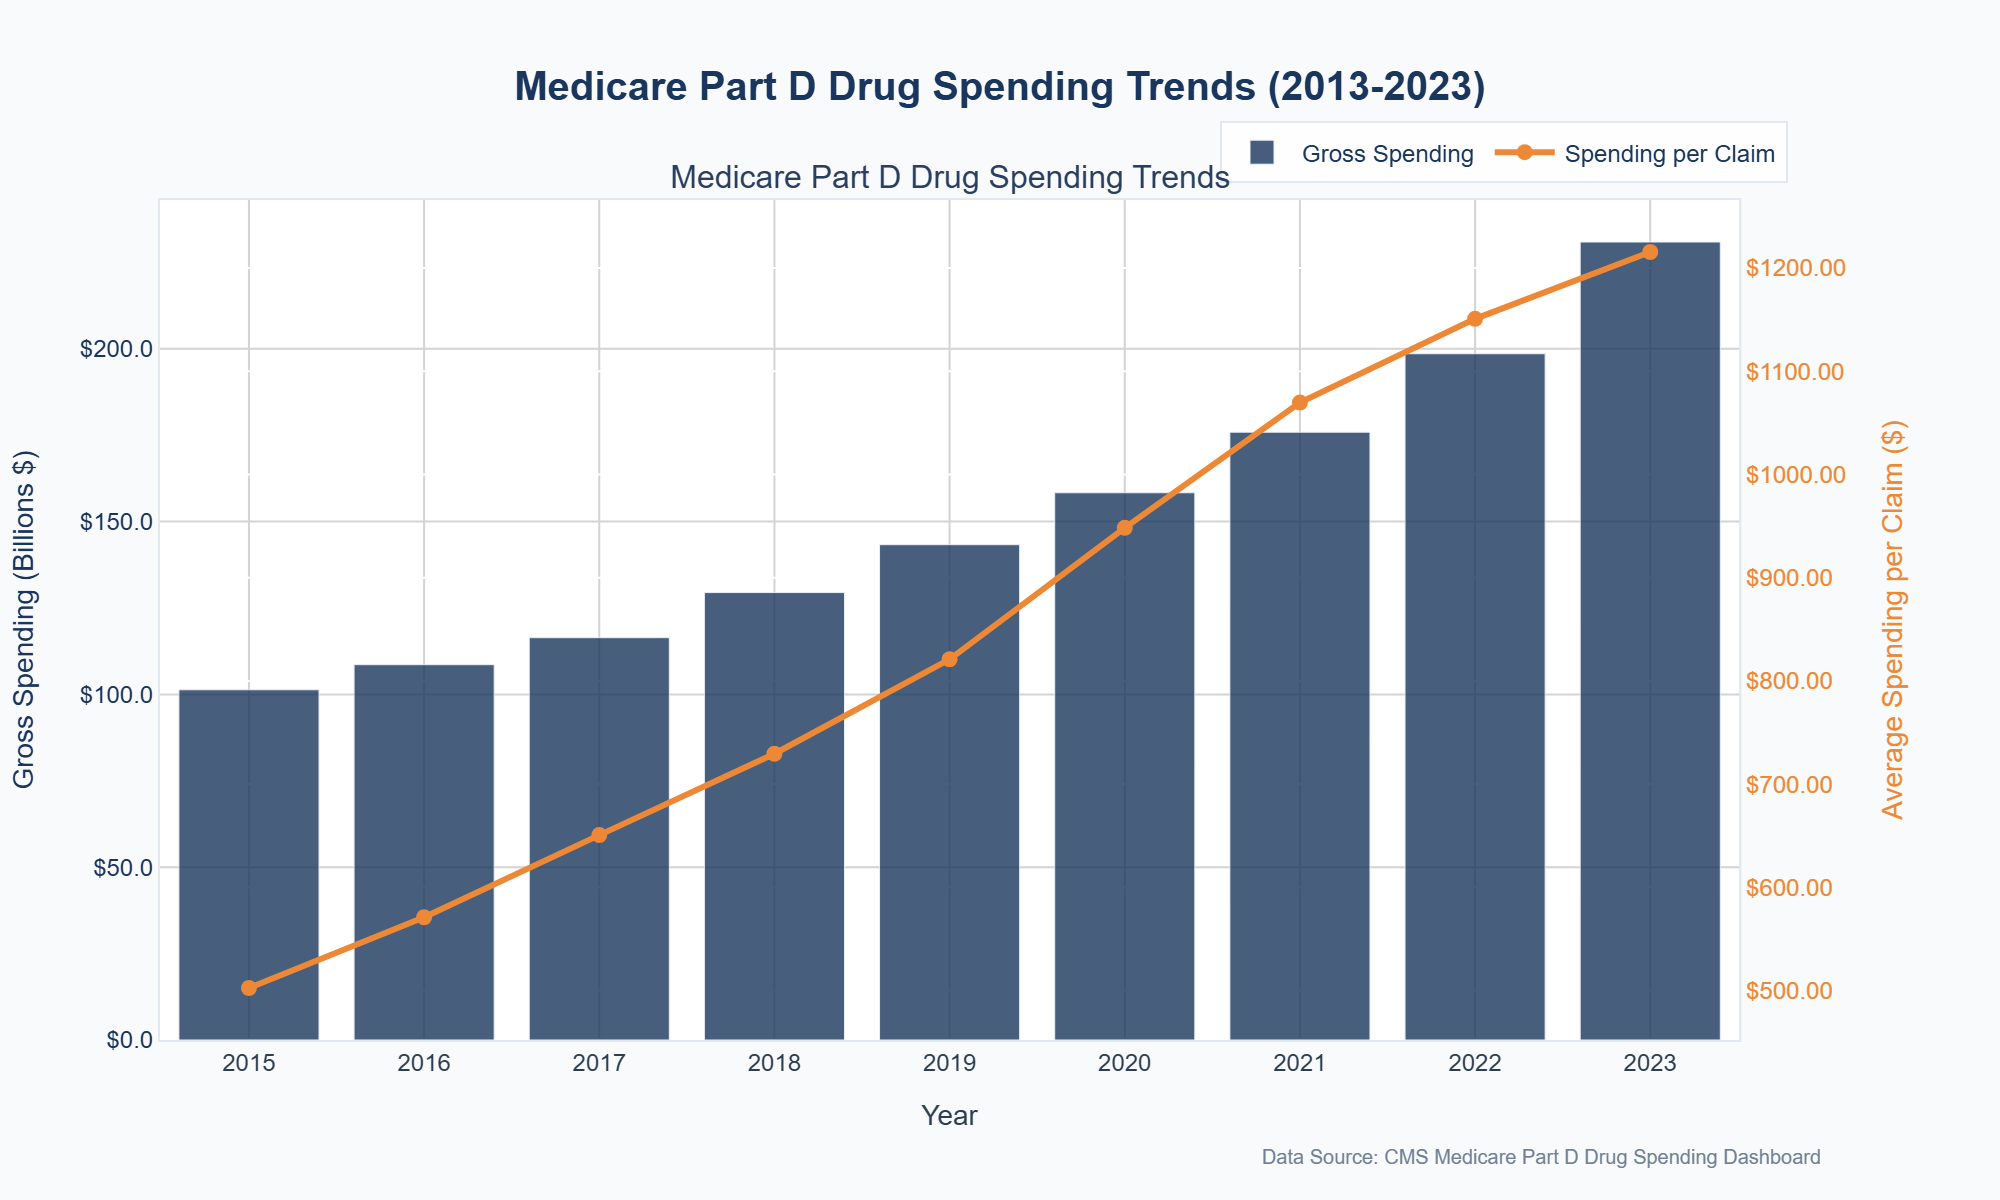
Figure 14
Source: Medicare Part D Dashboard (BRANDS ONLY)
Now because Medicare’s brand-name drug cost per prescription is up 141% over the same period that overall Medicare cost per prescription is up just 77%, you may think that generic prices in Medicare deflated to help offset the rising brand costs. However, Part D spending data show the average generic claim also rose between 2015 and 2023, from $26.28 to $29.76 (a 13.3% increase) (Figure 15):
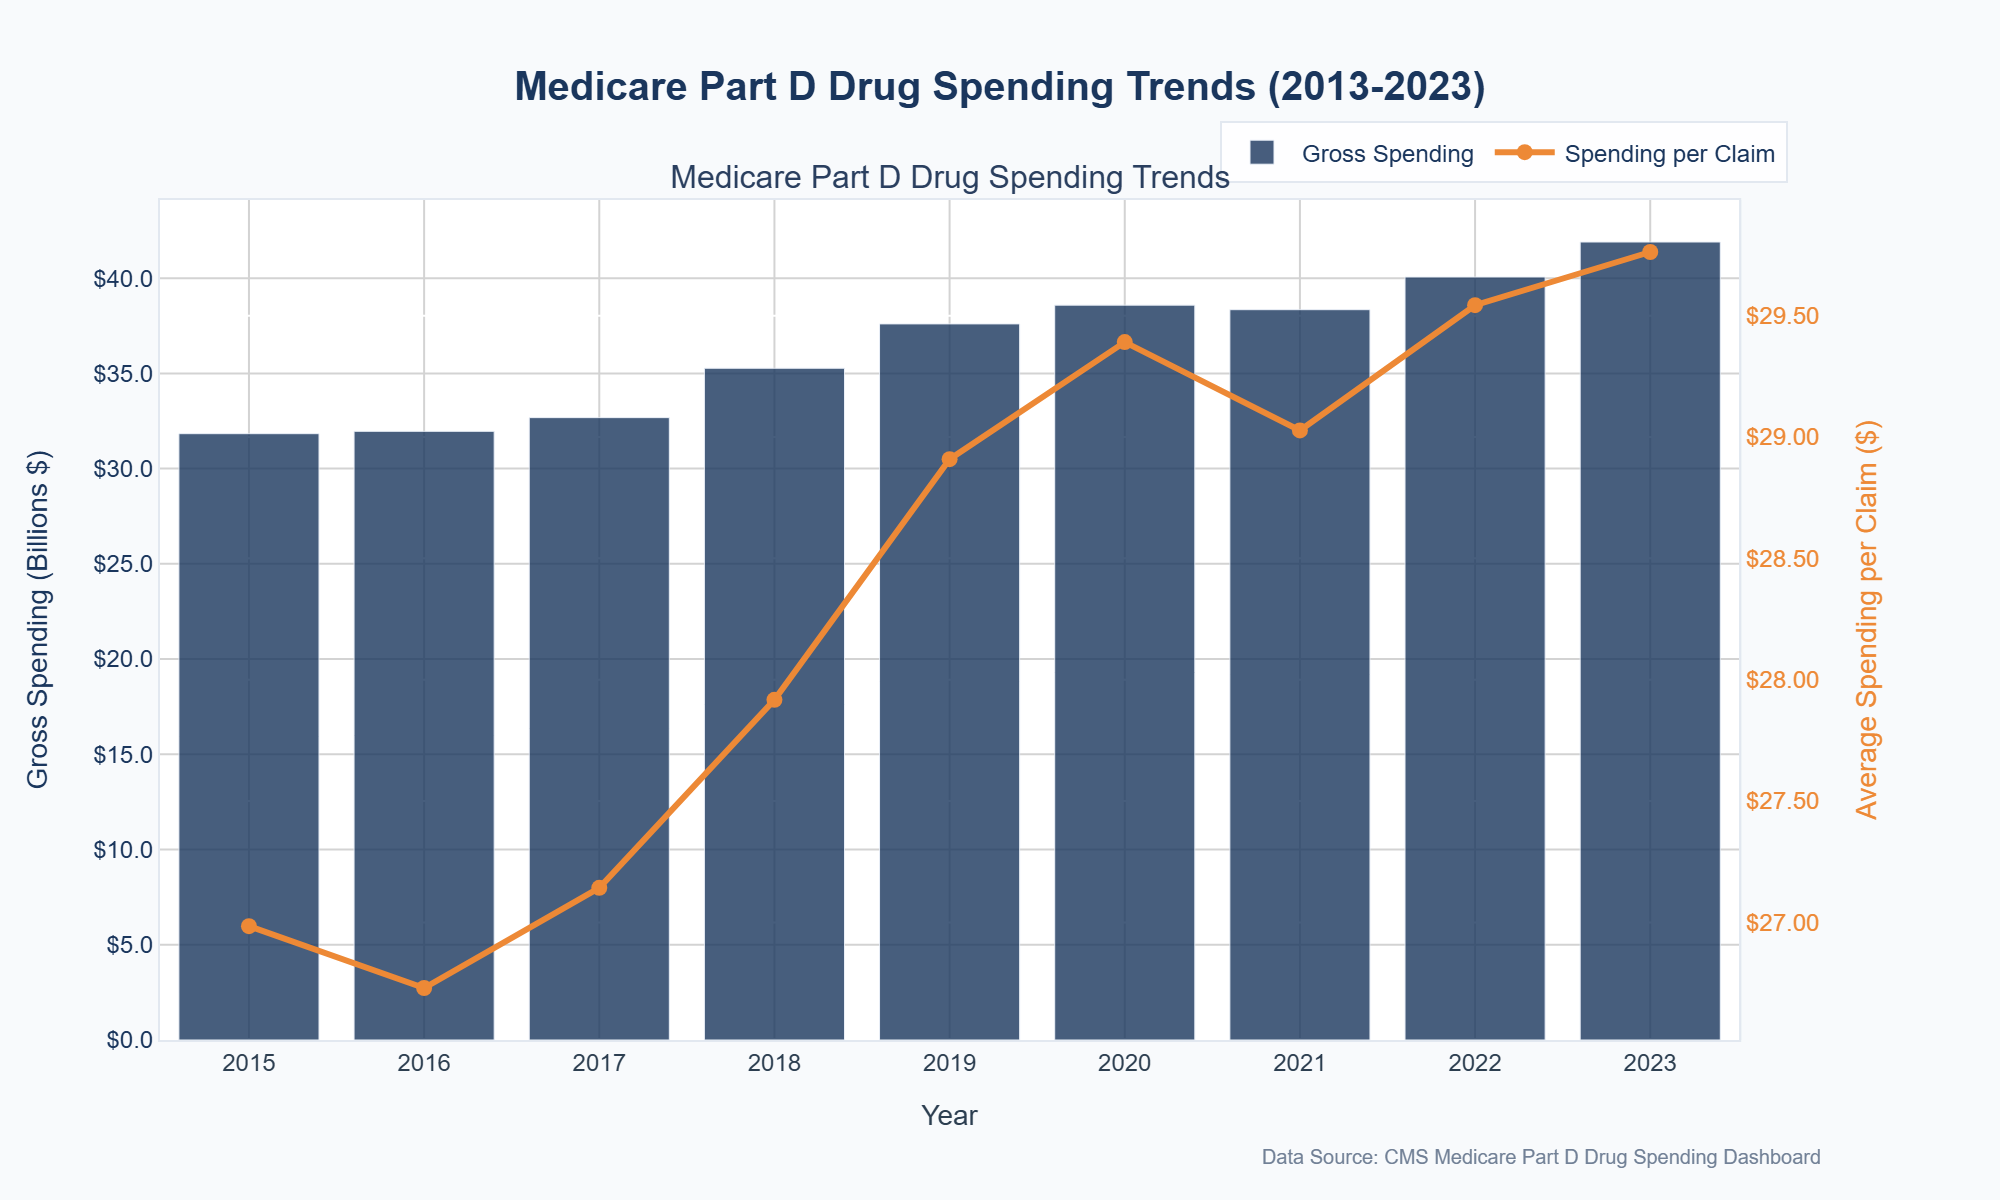
Figure 15
Source: Medicare Part D Dashboard (GENERICS ONLY)
To help understand the inflationary generic trend in Medicare over this time frame (around $40 billion dollars in gross expenditures can be hard to get a handle on), we first looked at the top 10 generic drugs by spending in 2015 and compared their average spending per claim in 2015 to that in 2023 (Figure 16).
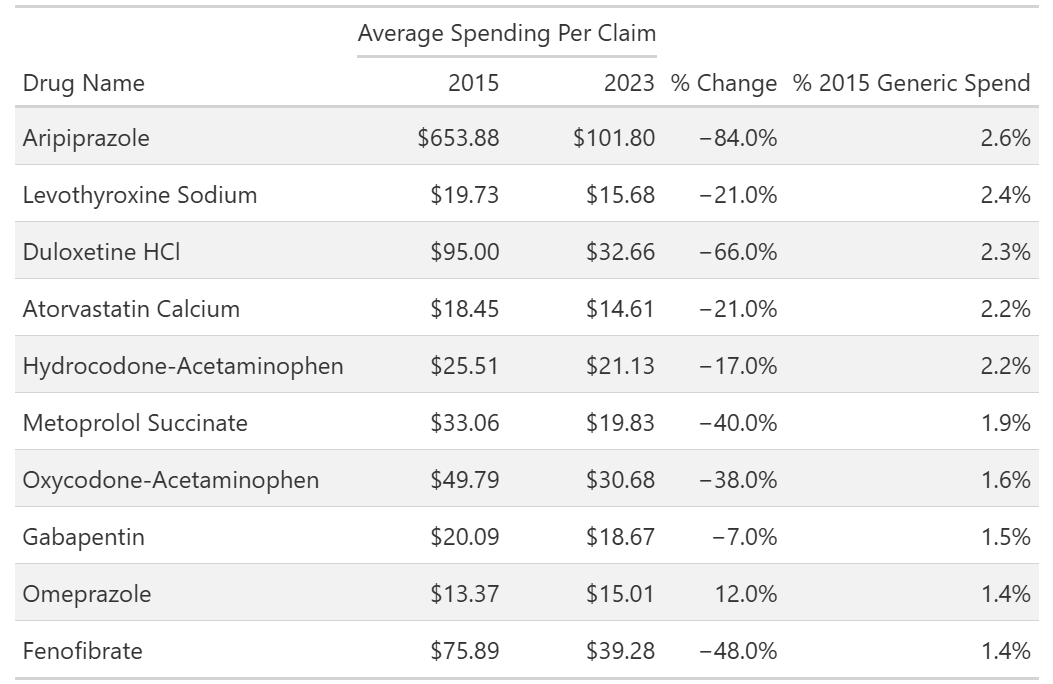
Figure 16
Source: Medicare Part D Dashboard
Figure 16 above shows that the top 10 generics by Medicare spending made up nearly 20% of all generic drug spending within the program in 2015 (or 1 in 5 gross generic dollars spent). This is beneficial, as it suggests we get a good sense for the overall generic market in Medicare with a review of just a few drugs.
We can also see within the above Figure 16 that the average spending per claim on these drugs generally decreased from 2015 to 2023, meaning generic drug deflation does seem to exist within Medicare even if it is not directly observed at the top level (which recall say generic drug spending rise 13.3%). Said differently, if we judged our Medicare generic book by its cover (Figure 15 previously), we would miss the fact that 9 out of 10 of the top generic medications got cheaper from 2015 to 2023.
Of course, one of the drugs above appears to be an outlier — omeprazole. It’s a drug we’ve identified in the past as an outlier for markups in Medicaid programs. And if we look at our NADAC Dashboard for omeprazole pharmacy acquisition cost pricing trends from 2015 to 2023, we don’t see a good reason why omeprazole prices would have increased 12% in Medicare Part D in the aggregate (Figure 17):
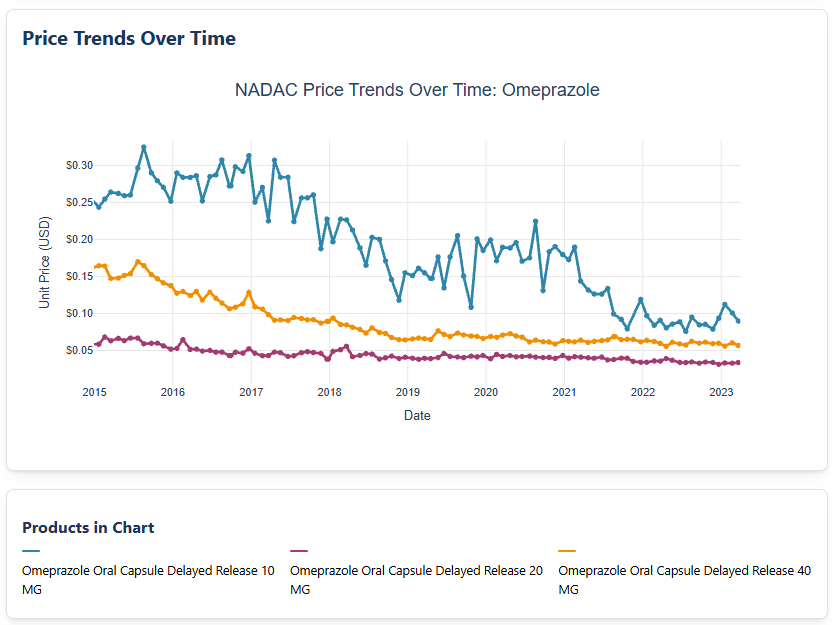
Figure 17
Source: Centers for Medicare & Medicaid Services NADAC
Figure 17 shows us that with NADAC as our guide, omeprazole costs are down — not up — over this time frame (depending upon strength, anywhere from 50% to 63%; 10 mg strength went from $0.24 in Jan 2015 to $0.09 in December 2023; 40 mg strength went from $0.16 to $0.06; 20 mg strength went from $0.06 to $0.03). Now, while we could play naïve and pretend like we don’t know what’s going on, we’re not going to do that. The fact of the matter is, Medicare drug costs are not fundamentally required to be rationally set to what a drug’s acquisition costs actually are — that does not exist within the Medicare Part D Manual or bid process today. And so, drugs can increase in cost even when market signals show the drug is getting cheaper.
In order to show you what we mean, we next examined all generic drugs with average spending data in both 2015 and 2023, comparing the 2015 average spending per claim with that in 2023. Nearly as many generics experienced a decrease (51%) as an increase (49%) in average spending per claim. However, the majority of 2015 spending (72%) was for drugs in the decrease group. The average percent change in spending per claim for the decrease group was -30%, while for the increase group it was +22% (Figure 18).

Figure 18
Source: 46brooklyn Research analysis of Medicare Part D Dashboard
So while the majority of generic spending in 2015 got cheaper in 2023 (the most recent year for which we have Medicare data), there was a subset of generic drugs that got more expensive. And as omeprazole demonstrated, that subset may be increasing in price without an obvious, market-driven cause.
Within our thesis, we view this as our first key observation. We do not know how CBO cost projections entirely work, but we imagine that they likely rely upon aggregate observations. And according to basically everyone, but let’s use the FDA, when more copies of a drug comes to market, the cost of that drug is supposed to go down (not up). And over time, it is true that more generic drug copies are going to come to market and so it should also be true that more costs should come down. And yet, on a product basis from 2015 to 2023, we have roughly equal odds that our product went up or down in cost in Medicare (i.e., product count line in figure above are 426 vs. 406). In other words, if you were building a model, did your model think that half of the generic drugs would go up in price over time? Based upon what we think we know about drug pricing and competition from sources like the FDA, probably did not expect half of generic drugs to go up.
High-spend generics in Medicare
The Pareto Principle (80/20 rule) suggests a small number of items often account for a large proportion of the overall effect. Healthcare spending is full of anecdotes/data to this effect. And while we have seen some of that already here (i.e., 10 generic drugs in 2015 representing 20% of all 2015 drug expenditures), we feel compelled to get others’ opinions. Anthem says a small number of claims are responsible for 30% of plan expenditures. Sun Life’s analysis said as few as 5,000 claims generated $1.2 billion in spending. Three’s a crowd, so let’s roll with it.
With this principle in mind, we examined which generics in 2023 had total spending greater than the #1 top-spending generic in 2015 — aripiprazole. (We’re using 2023 as that is the most recent year of data in the Part D Dashboard). In other words, we’re asking the data which generic drugs Medicare spent more than $830 million on back in 2023. Only three generics met this criterion: lenalidomide, atorvastatin, and abiraterone (Figure 19).
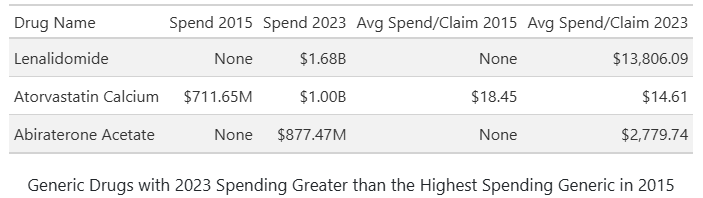
Figure 19
Source: 46brooklyn Research analysis of Medicare Part D Dashboard
Of these, as shown in Figure 19, only atorvastatin had generic claims in 2015. For atorvastatin, average spending per claim actually decreased from 2015 to 2023. In asking NADAC (Figure 20) about atorvastatin costs over this time frame, it agrees directionally that pharmacy acquisition costs for atorvastatin are going down (although the scale of NADAC price decreases don’t seem to align with the scale of Medicare’s average atorvastatin cost-per-claim decline).
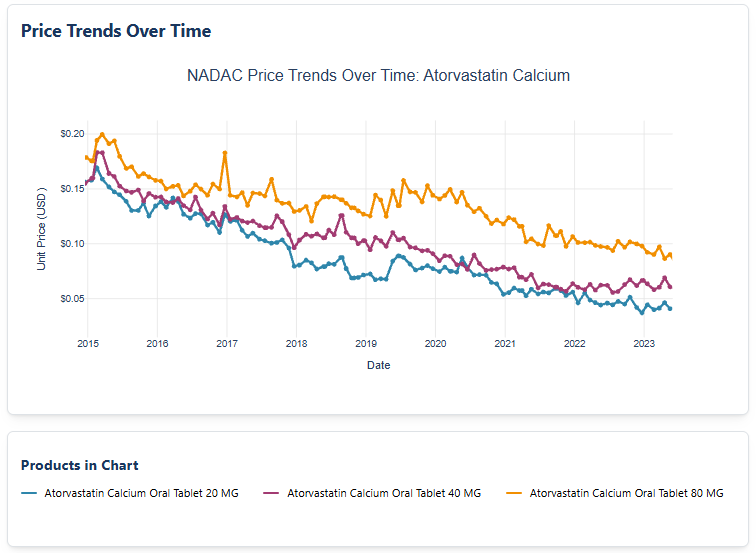
Figure 20
Source: Centers for Medicare & Medicaid Services NADAC
In contrast, lenalidomide and abiraterone were not available as generics in 2015 (so we cannot say what is going on with the trend in prices for these drugs), but by 2023, both exhibited average spending per claim far above the 2023 generic average of $29.76 (see Figure 19 previously). Specifically, lenalidomide’s average claim cost was $13,806.09 — over 460 times higher than Medicare’s 2023 average generic claim cost — while abiraterone’s was $2,779.74, nearly 100 times greater.
So we obviously need to study these “special” generic drugs if we want to understand trending in Medicare over time, and what better place to start than with the generic drug at the top of the 2023 pile — lenalidomide (or generic Revlimid).
Getting Wrecked by Revlimid (lenalidomide)
Our understanding of generic lenalidomide begins with the brand-name version of the medication. Marketed as Revlimid, lenalidomide is primarily prescribed for multiple myeloma and other hematologic malignancies (aka blood cancers). Approved by the FDA in 2005, Revlimid quickly became a blockbuster due to its clinical effectiveness. Originally developed by Celgene (acquired by Bristol-Myers Squibb in 2019), its brand-name market exclusivity was extended through a combination of patents and legal settlements. Although the main patent expired in 2019, Bristol-Myers Squibb negotiated agreements with generic manufacturers that delayed broad generic entry until 2022, initially permitting only limited quantities of generic drugs to enter the market. These restrictions are not going to be fully lifted until this year, allowing Bristol-Myers Squibb to maintain market share and pricing leverage well beyond the original patent expiration.
Lenalidomide is subject to a restricted distribution model: only select specialty pharmacies are authorized to dispense both brand and generic versions of the drug. In other words, rather than potentially getting this medication filled at any of the 60,000 or so U.S. retail pharmacies, patients instead must get the medication filled at a pharmacy approved by the drug manufacturer. This restriction, based on the drug’s risk profile, requires pharmacies to participate in a Risk Evaluation and Mitigation Strategy (REMS) program mandated by the FDA. The limited distribution model reduces competition among pharmacies, potentially enabling both brand and generic versions to sustain higher prices.
A restricted distribution model is atypical and represents the first rabbit hole worth exploring as it relates to Revlimid.
A review of authorized Revlimid pharmacies reveals that: (1) there are not that many; and (2) many are vertically integrated within the drug supply chain (Figure 21):
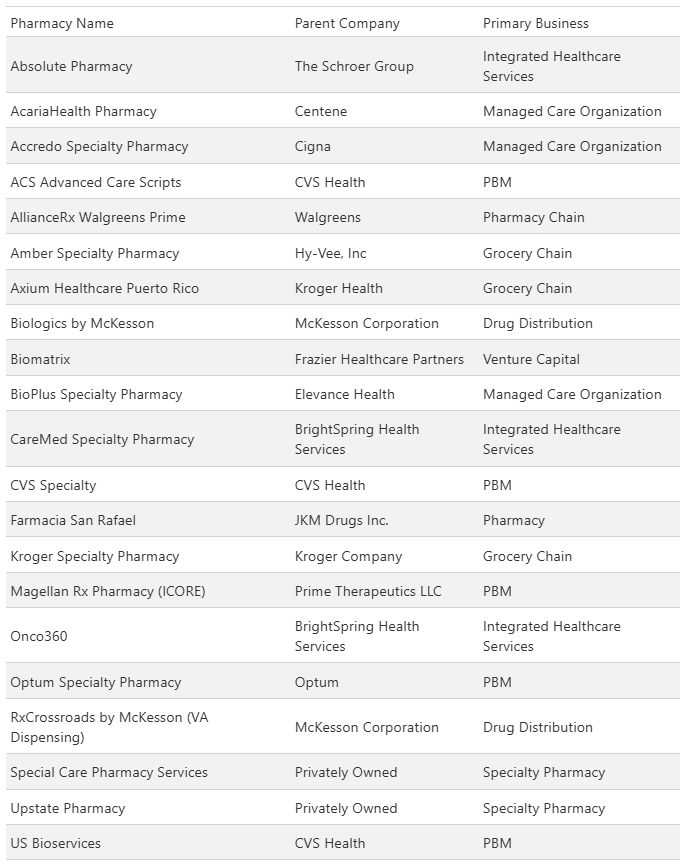
Figure 21
Source: Bristol-Myers Squibb Authorized Revlimid Pharmacies
As can be seen above, several specialty pharmacies are owned by or affiliated with large pharmacy benefit managers (PBMs), health insurers, or major distributors — entities that influence both pricing and market access. This vertical integration can create conflicts of interest, as organizations may be involved in both setting and paying the price (see far right column of Figure 21).
Now, just because a pharmacy is within the restricted distribution program does not mean that each pharmacy is given equal opportunity to dispense Revlimid. In other words, we are not aware that anything within the program guarantees each pharmacy will dispense a certain number of prescriptions of Revlimid. However, the list above (Figure 21) does give us a sense for which pharmacy may be more likely to dispense a Revlimid prescription relative to another. We know that the system is not a lottery and that not all pharmacies are created equal. Pharmacy networks from PBMs, plan benefit design decisions, patient preferences, and a host of other factors influence which pharmacy will actually dispense Revlimid when a patient needs it.
Undoubtedly on the of the key considerations for which pharmacy will dispense or not is whether the pharmacy is in network for a particular plan/PBM. As we will show, Revlimid is an expensive medication historically AND is used to treat a condition that primarily effects older adults (i.e., those in Medicare). As a result, to get a sense of which pharmacies are most likely to dispense Revlimid, we analyzed Part D enrollment files alongside the Part D pharmacy network files for 2025 to understand how the parent companies’ networks of lenalidomide specialty pharmacies compete for Part D lives. The Part D enrollment files tell us which specific plans have how many people under them and the network files tell us for each plan which pharmacies their enrolled members are eligible to get prescriptions filled at. Putting them together gives us a sense of how many people have the opportunity to fill Revlimid based upon which pharmacies their plan included within their plan’s specific network. In other words, our analysis seeks to understand which pharmacies have access to the highest number of lives and therefore have better odds to potentially be the pharmacy selected (via the other factors) to dispense the medication.
Figure 22 shows that a few companies have access to the majority of Part D lives, while others have little to no access. Despite 21 pharmacy groups being permitted to distribute the drug, the complexity of network access and design may further limit market competition if only five have access to more than half the lives (maybe 7 if we round to the 10-digit).
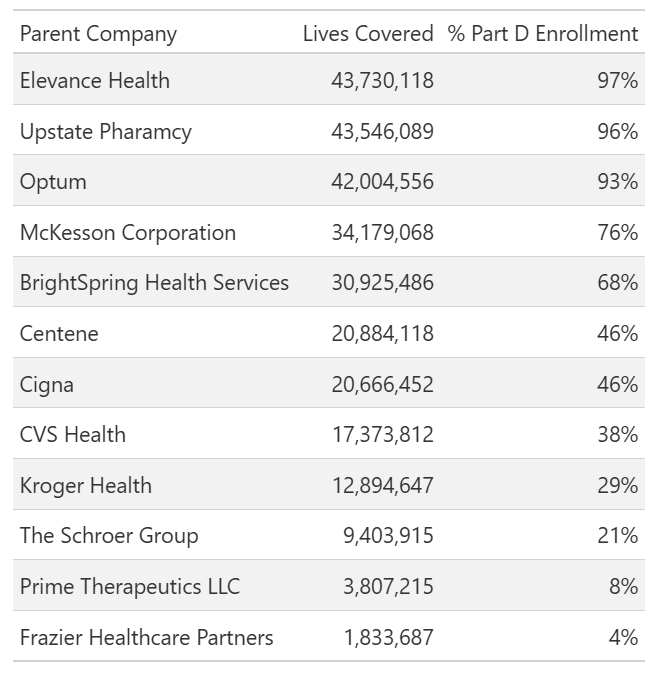
Figure 22
Source: 46brooklyn Research analysis of Part D enrollment files alongside the Part D pharmacy network files
Note: The Part D network files do not contain information on Employer Sponsored Plans (ESPs), so Figure 22 reflects Part D enrollment for non-ESP plans only — roughly 80% of total Part D enrollment. Additionally, we relied on the accuracy of the network files and Bristol-Myers Squibb (BMS) pharmacy names to match NPI numbers.
Alright, now that we have some background on Revlimid and some basics on its market distribution, let’s see how this drug’s set-up may wreck our prescription drug finances in ways we may understand (i.e., things we’re written about before at 46brooklyn), but not fully appreciate.
Wrecklimid
In 2023, Medicare Part D gross spending on generic lenalidomide reached nearly $1.7 billion (Figure 23), making it the #1 drug by generic expenses (accounting for about 4% of all generic Part D expenditures) and representing more Medicare gross expenditures than brand-name medications outside the top 28 (i.e., it was the 29th most expensive therapy in all of Medicare Part D in 2023 [and since it is a generic and doesn’t pay comparable rebates, maybe even higher up the list on a net pricing basis than some of the brands in front of it]).
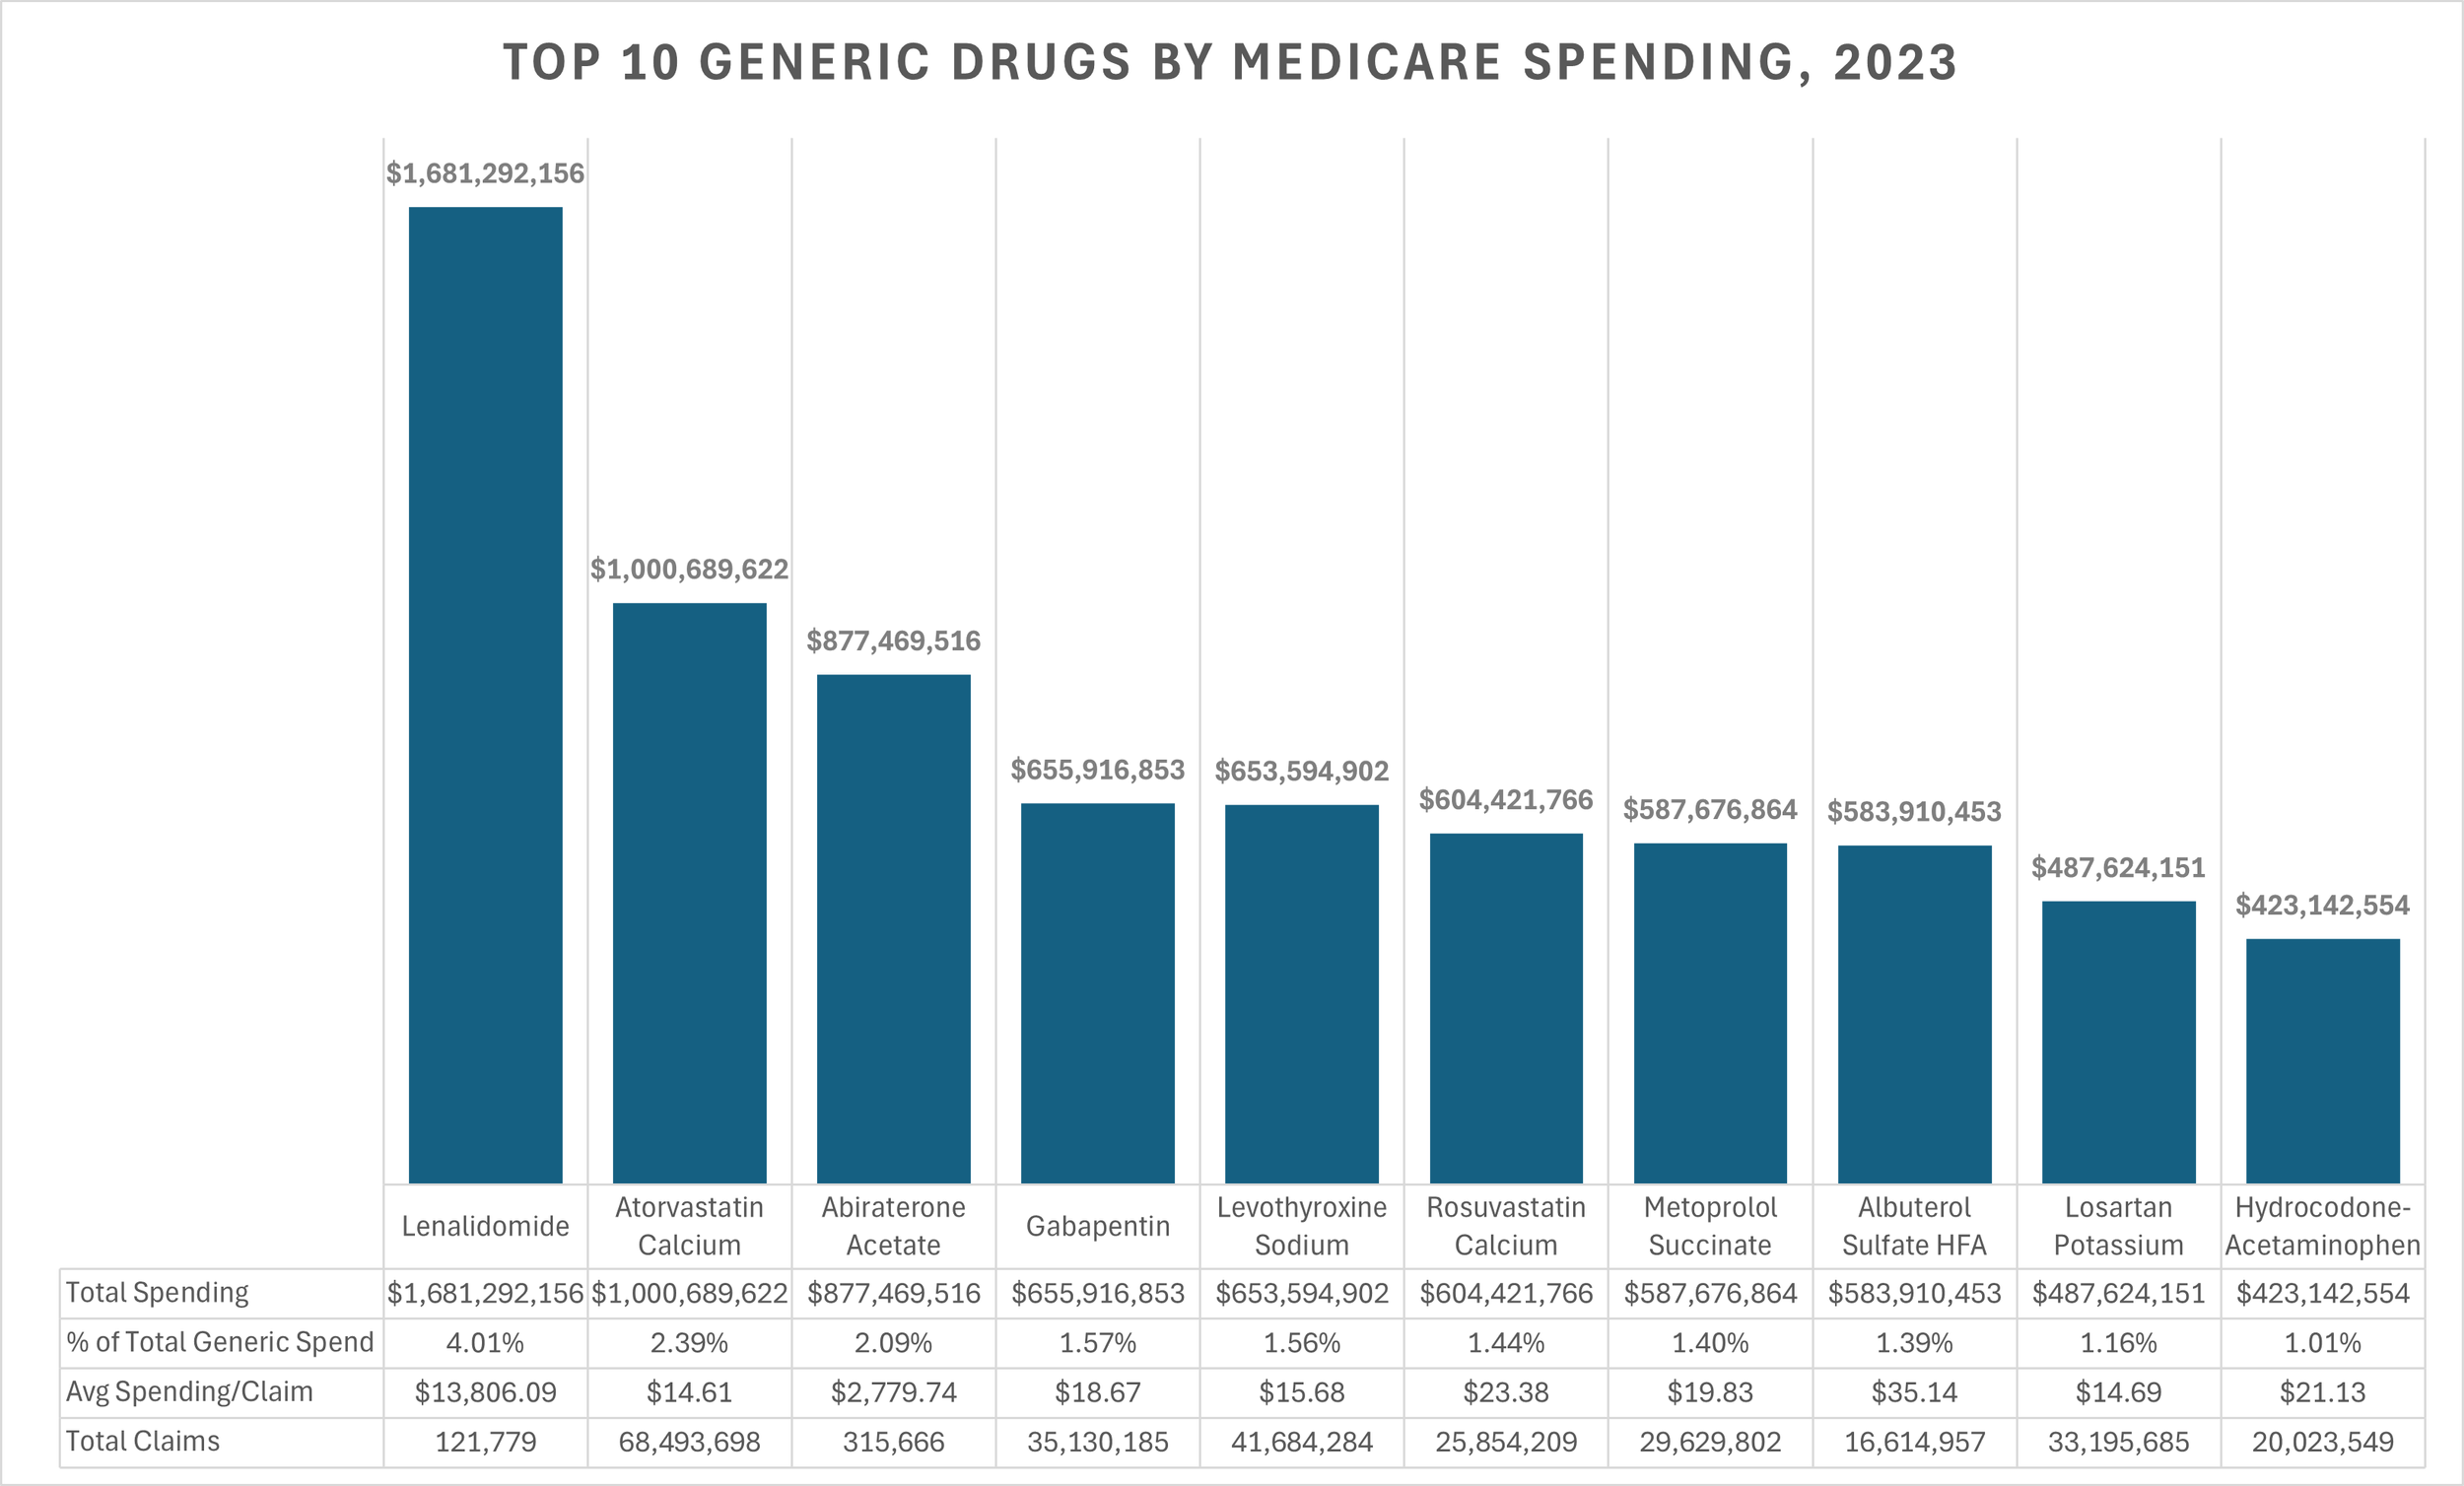
Figure 23
Source: Medicare Part D Dashboard
Let Figure 23 sink in for a moment. Generic Revlimid, a medication used by less than 1% of Medicare beneficiaries in 2023 (20,403 beneficiaries total) cost more than atorvastatin, a medication used by approximately 1 in 3 Medicare beneficiaries (almost 17 million Medicare Part D beneficiaries in 2023 used atorvastatin). More revenue was directed to the less than two dozen pharmacies that can dispense lenalidomide than the number one dispensed drug for all retail pharmacies. Wild.
What’s more, is it is highly likely, all else being equal, that lenalidomide’s share of total generic spend will continue to rise through at least 2026 (recall that this data is from 2023; the most recent in the public domain), when distribution restrictions are fully lifted. However, this situation is unprecedented, and it is unclear how the market will respond once restrictions end — especially given factors like limited distribution networks, minimal competition due to network arrangements, vertical integration for the majority of the dispensing entities, and the lack of transparent cost-based pricing benchmarks (such as NADAC) for this generic drug. Said differently, if only two dozen or so pharmacies are dispensing this medication today, when restrictions end, will more people come into the market to supply it or will they keep going to where they’ve been getting it from for years? Will the PBMs — who have their own specialty pharmacies — really want to open access in an otherwise protected environment for their affiliate companies? What incentives exist to allow pharmacies access to the network to dispense these drugs relative to what tools may be used to restrict access?
Demand analysis for Revlimid
To assess whether aggregate demand for Revlimid (lenalidomide) persisted after generic entry, we wanted to estimate 2021 payer-level unit volumes (i.e., the year before generic entry) and compare them to reported unit sales in 2022 and 2023 to develop trends. We used Medicaid State Drug Utilization Data, Medicare Part D Spending by Drug, and manufacturer-reported U.S. sales to construct a comprehensive view of the market. We start with the Medicaid data because it is NDC specific, and we can use the NDC-specific information to get a sense for the average spend per unit. And while Medicaid may pay various rates across the 50 states, we can rely upon the drug manufacturer’s list price (WAC) to get an average WAC price per unit across all the Medicaid claims in 2021. Using that weighted WAC of $797.34 per unit, we can attempt to keep all our units in the same manner as we assess Medicare and commercial spending.
In 2021, total U.S. Revlimid sales reached $8.7 billion. Medicaid accounted for $439.2 million (550,792 units × $797.34), and Medicare accounted for $5.6 billion (7,014,708 units × $797.34). By subtracting these public channel sales (Medicare and Medicaid) from the manufacturer’s total, we estimated commercial sales at approximately $2.7 billion, or about 3.3 million units. Now that we have a sense for the Revlimid market in 2021 (Figure 24), we can use that intelligence to roll the clock forward with data for the subsequent years (i.e., the time after generic entry).
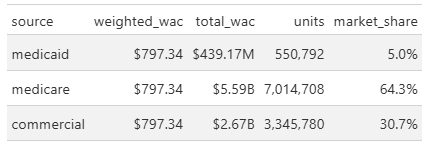
Figure 24
Source: 46brooklyn Research analysis of State Drug Utilization Data (SDUD), Medicare Part D Dashboard, Elsevier Gold Standard Drug Database (GSDD), and Revlimid US sales data
To compare demand over time, we used the combined Medicare and Medicaid unit baseline from 2021 and evaluated reported unit sales for brand Revlimid and generic lenalidomide in 2022 and 2023. This approach allowed us to determine whether overall utilization changed following generic entry, and to establish a baseline for projecting future channel market share. To do this, we compared the 2021 combined Medicare+Medicaid unit baseline (≈7,565,500 units) to reported unit sales in 2022 and 2023 (Revlimid + generic lenalidomide) to assess whether aggregate demand changed post‑generic entry. Figure 25 summarizes our efforts to review the data on Revlimid units in Medicaid and Medicare from 2022 to 2023:
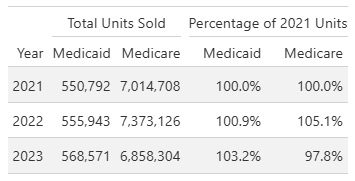
Figure 25
Source: 46brooklyn Research analysis of State Drug Utilization Data (SDUD), Medicare Part D Dashboard, and Revlimid US sales data
We do this all to get a sense of demand over time. Because of this consistent demand (as shown in Figure 25), we can use Figure 24 as a baseline for projecting channel market share. As discussed, BMS was able to delay full generic launch of lenalidomide until 2026 by negotiating limited entry agreements with generic manufacturers. As a result, generic penetration in Medicare Part D has been gradual. In 2022, generic penetration was only 9%, and in 2023 it was 36% (see Figure 26)
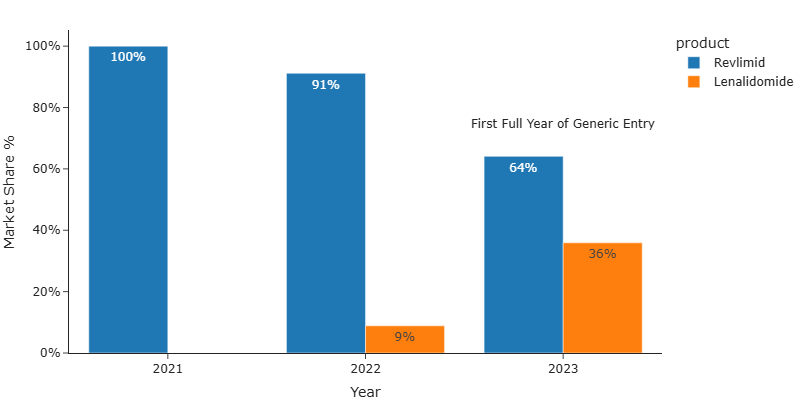
Figure 26 Medicare Part D Market Share - Revlimid (brand) v. Lenalidomide (generic)
Source: 46brooklyn Research analysis of Medicare Part D Dashboard
To forecast yearly changes in lenalidomide (Revlimid) market share, we compiled U.S. Revlimid sales data from BMS reports for 2021 through 2024. For 2025, we projected full-year sales by annualizing Q3 2025 data (“Bristol Myers Squibb Reports Fourth Quarter and Full-Year Financial Results for 2024,” n.d.; “Bristol Myers Squibb Reports Third Quarter and Financial Results for 2025,” n.d.). Using the yearly weighted WAC, we believe that we can reasonably estimate unit sales for each year (see above).
We then compared these annual unit sales to the 2021 baseline to estimate the degree of generic penetration over time. As shown in Figure 27, Revlimid unit sales have an estimated decline of 80.1% from 2021 to 2025, implying an 80.1% generic penetration rate by 2025.
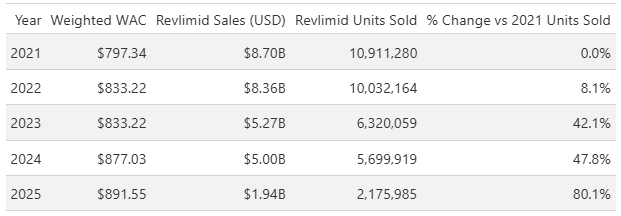
Figure 27
Source: 46brooklyn Research analysis of Medicare Part D Dashboard
The projections align with the Part D finding in Figure 26, where Part D generic penetration reached 8% in 2020 (vs. 8.1% all channels), and 36% in 2023 (vs. 42.1% all channels). It is always nice when numbers generally align, as it gives us a sense of reliability in our analysis (instead of say PBM pricing variability of abiraterone pricing which was 10-fold or more variable, if you catch our meaning 😉)
Wrecking Medicare finances
Medicare Part D spending data allows us to track the average unit charge for lenalidomide. The most recent data, from 2023, shows the average unit charge declined slightly from $687.33 in 2022 to $682.56 in 2023 (see Figure 28 below). But it would be nice to know pricing dynamics more in the here and now than three years ago. To assess how well payer-reported prices reflect actual payments, we compared these observed charges to the average unit price reported in the Medicare Part D Quarterly Drug Files (things we have written on previously and even have a dashboard of on our website). Calculating the percent difference between the historic quarterly files that overlap with our observed actual price, we found that the reported price would have overestimated actual gross payment by 6.7% in 2022 and 3.7% in 2023 (Figure 28). In other words, we believe we can rely upon the reported price within the quarterly Medicare files and be within approximately 5% of actual experience (or pretty close).
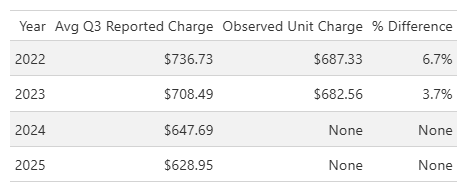
Figure 28
Source: 46brooklyn Research analysis of Medicare Part D Dashboard and CMS Medicare Quarterly Prescription Drug Plan Formulary, Pharmacy Network, and Pricing Information files
These modest differences (as measured by percentages) between reported prices and observed prices suggest, at least in our minds, that the reported values can serve as a reasonable proxy for estimating future Part D payments for lenalidomide. Based on this analysis, we may reasonably expect the lenalidomide average unit price in Part D to decline from 2023 to 2025; going to $647.69 in 2024 and $628.95 in 2025.
Note: The Medicare Part D Quarterly Drug Files do not represent actual payments, but rather estimates of what Part D drug plans may reimburse for a given drug. The last time we talked about these files, we got lots of comments that they weren’t real prices. And while these files underpin the Medicare Part D Plan Finder, which is used by beneficiaries to compare plans AND despite CMS comments that they’re supposed to be average plan prices, we do this price analysis comparison to demonstrate what we think the files offer - valuable insights into the potential reimbursement landscape for Lenalidomide in the more near-term than 2023. In other words, our reliance on the quarterly files may mean we could be off on the numbers (say 5%; see Figure 28), but we anticipate we’ll only be off by a little and not 1,000% or 10,000% (which others seem to accept as reasonable variance; see abiraterone pricing). So in layman’s terms, take this as a directional representation of reality more so than perfect and precise actual numbers.
Using Medicare Part D spending data, we determined that 7,014,708 lenalidomide units were dispensed through the program in 2021. This serves as our baseline for projecting 2024 and 2025 expenditures. According to Figure 27, the generic dispense rate for Revlimid in Part D is expected to reach 47.8% in 2024 and 80.1% in 2025 (based upon our demand analysis). By applying these rates to the 2021 baseline, we estimate the number of lenalidomide units dispensed in 2024 and 2025 (see Figure 29).
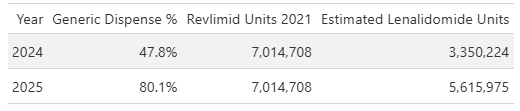
Figure 29
Source: 46brooklyn Research analysis of Medicare Part D Dashboard and CMS Medicare Quarterly Prescription Drug Plan Formulary, Pharmacy Network, and Pricing Information files
As seen in Figure 29, we project 3,350,224 units dispensed in 2024 and 5,615,975 units dispensed in 2025. To estimate total Part D expenditures for lenalidomide, we multiply these unit counts by the reported price observations for 2024 and 2025 from the Medicare Part D Quarterly Drug Files (Figure 28). The result (Figure 30) is our forecast for experience that Medicare has already had (i.e., eventually we’ll be able to see how correct we were or were not). In other words, 2024 and 2025 experience already exists on paper or in some Medicare database, but we don’t see that data yet because it’s not reported in the public Part D dashboard, so we’re trying to create a reasonable approximation.
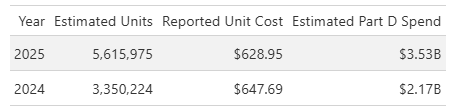
Figure 30
Source: 46brooklyn Research analysis of Medicare Part D Dashboard and CMS Medicare Quarterly Prescription Drug Plan Formulary, Pharmacy Network, and Pricing Information files
Ultimately, our data suggests that Medicare Part D spending on lenalidomide will have risen to $3.5B in 2025, up from $1.7B in 2023 — more than doubling in just two years. For context, we previously identified that lenalidomide accounted for over 4% of total Part D drug spending in 2023 (Figure 23). If spending does in fact double, lenalidomide could represent upwards of 8% (about 1 in 10 dollars) of total Part D drug spending in 2025.
It is not unusual for a single brand drug to account for a large share of total drug spending — Humira, for example, has historically represented a significant portion of overall costs, but that should be expected for a popular brand-name drug. However, this is highly atypical for a generic drug.
But what about the drug manufacturers?! Can’t we blame them?!
A common response to prescription drug pricing analysis is to blame the drug manufacturer for pricing woes. Afterall, the drug manufacturer develops the drug and sets the list price of the medication and pays any rebates that will impact the net pricing. But rebates only really matter for brand-name medications and list price dynamics are only directionally equal for brands as well. For example, when we look at CMS’ NADAC equivalency (Figure 31), the relationship between WAC (a drug manufacturer’s list price) and NADAC (surveyed pharmacy acquisition costs) for brands is relatively close (i.e., less than 5% difference), but for generics, well the relationship is not close at all (~50% away from the WAC price)

Figure 31
Source: CMS NADAC Equivalency Metrics
Despite what we think we know about generic drug pricing, and in keeping with our promise of a long report, we figured it is worth looking into generic manufacturers for lenalidomide to determine what we might learn about their role in this drug pricing conundrum for Medicare.
Analysis of 2023 Part D spending data reveals that generic lenalidomide manufacturers received highly uneven product allocations. For instance, Teva Pharmaceuticals captured 28% of the Part D market, while the next largest, Dr. Reddy’s, held just 15.6% (Figure 32). Given that overall generic penetration was only 36% in 2023, these disparities suggest that allocation agreements — rather than open competition — may be a contributing factor limiting broader market access for most generic manufacturers.
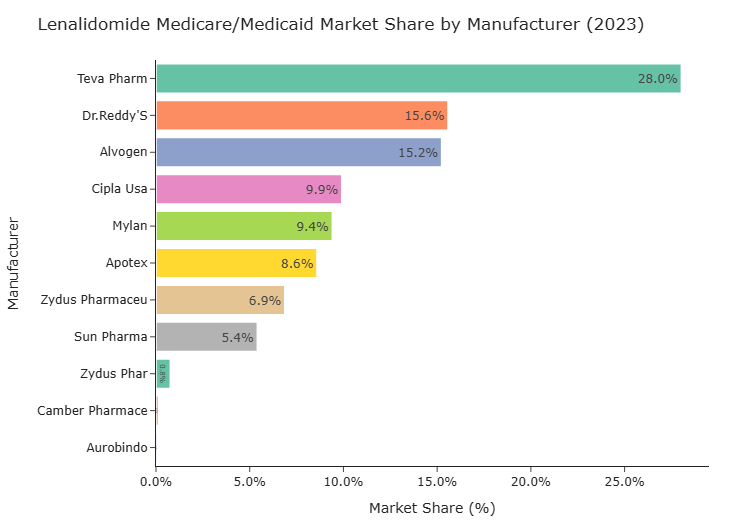
Figure 32
Source: 46brooklyn Research analysis of Medicare Part D Dashboard
To assess whether increased competition or expanded allocations influenced pricing, we examined WAC pricing by manufacturer from 2022 to 2025. Afterall, if any of this was logical, we would expect purchasers to gravitate to those products with the lowest prices (since it could mean they potentially make the most money; buying low and selling high). Well, what we observe is that despite more manufacturers entering the market and allocations gradually increasing, nearly all manufacturers priced their products at similar levels throughout this period.
And because we cannot show you the proprietary AWP and WAC prices (which is lame), in Figure 33, we can show you that these prices were effectively all the same by showing what the AWP-to-WAC ratio was for these products. If the numerator (AWP) and the denominator (WAC) are the same, the same ratio will be produced (yes, we know that there are other mathematical ways for the ratio to be the same without the same exact numerator and denominator, but we cannot show you the actual numbers so please take our word that it’s the numbers being the same [outside of Exelan] that is causing this ratio to be the same). We added a column that measures the AWP discount to the brand Revlimid for each generic version (AWP Discount to Brand column) to help show at least that the numerator of these is the same [if each generic drug is effectively the same numerator, as demonstrated by having this same discount value, then the only way for the ratio to be the same is as we described]). As shown in Figure 33, the AWP-to-WAC ratio was nearly identical across manufacturers, resulting in a consistent AWP-to-WAC ratio.
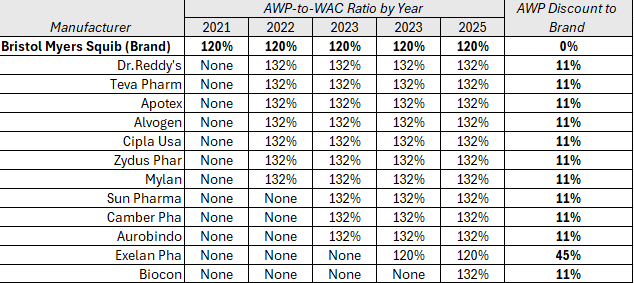
Figure 33
Source: 46brooklyn Research analysis of Elsevier Gold Standard Drug Database (GSDD)
Recall that AWP is a pricing benchmark that doesn’t really mean anything (see how at least one compendia describes AWP). Despite it not meaning anything, AWP matters a lot because it is the benchmark used in virtually all prescription drug contracts. In contrast, WAC means something because of a federal definition (a definition which is, in effect, that WAC represents the list price between drug makers and wholesalers). So if AWP represents the contract price basis of selling a drug, and WAC represents the starting point of wholesalers buying drugs from manufacturers, the ratio of AWP to WAC represents a measure of the gap where margin might be made between selling the drug (i.e., to health plans) and buying the drug (from manufacturers).
The data seems to suggest that manufacturer’s aren’t competing on price for this medication. The uniformity in AWP-to-WAC ratios (broadly) suggests that, even as nominal competition increased (more generic manufacturers per year), pricing remained tightly clustered — potentially as a result of ongoing allocation agreements and restricted market entry. When access is limited to a small number of specialty pharmacies, the purchasing process may also contribute to altered allocations. For example, it is unlikely that a pharmacy will carry multiple, different labelers for the same product (i.e., a pharmacy shelf will have just one manufacturer’s lenalidomide on-hand, not two). Furthermore, the nature of any off-invoice rebates or discounts are often opaque between pharmacies and wholesalers (which list price analysis — like AWP and WAC — may miss). Pharmacies may have incentives to collaborate with wholesalers and/or manufacturers to maintain high list prices, especially if reimbursement is based on list price in the absence of a public benchmark such as NADAC — a common scenario for specialty medications. This dynamic can help sustain elevated prices despite the appearance of increased competition. In other words, returning to what we identified earlier in this report, if you expect over time generic prices to go down in the face of rising competition, well “special” generics seem to go against the grain and potentially wreck what your mathematical projections might suggest will happen with the price over time.
Note: Exelan Pharmaceuticals, a subsidiary of Cipla Pharmaceuticals (“Cipla to Acquire 100,” n.d.), is a notable exception in Figure 33: it primarily supplies the federal government and veterans (“Exelan Pharmaceuticals,” n.d.) and does not seem readily distributed in the retail market. Exelan’s pricing provides a useful benchmark, as it consistently reports the lowest WAC, AWP, and AWP-to-WAC ratio among manufacturers.
Generic manufacturer revenue analysis
Lenalidomide’s persistently high WAC price, coupled with minimal price deflation, may significantly influence generic manufacturers’ revenue growth. In other words, if the above analysis represents that yes, generic drug manufacturers are to blame (whether through setting high prices or collusion or whatever), then we may have our answer to why lenalidomide is costing Medicare so much money. However, it seems a claim worth further investigation.
To quantify the potential impact between Medicare increased spending and these generic drug manufacturers top-line financials, we calculated each manufacturer’s estimated change in revenue from lenalidomide sales in the Part D program by applying their respective market shares to observed sales data for 2022 and 2023. We then compared these figures to the manufacturers’ global revenue changes over the same period (i.e., how much money did they make selling all the generic drugs they sold), as shown in Figure 34.
Note: This analysis focuses on manufacturers with at least a 5% Part D market share. Mylan was excluded due to a decline in revenue between 2022 and 2023, and Alvogen was omitted because, as a private company, its financial information is not publicly available.
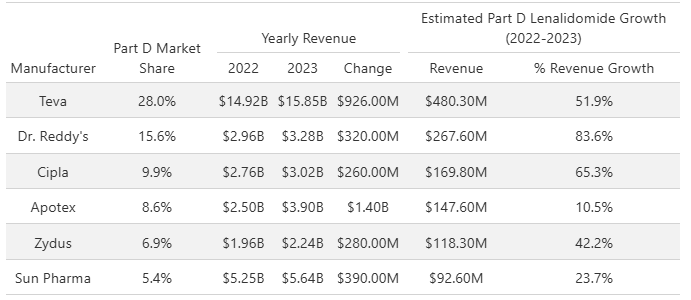
Figure 34
Source: 46brooklyn Research Analysis of Drug Manufacturer Financial Reports (Annual 10Ks for 2023) and Medicare Part D Dashboard
The data indicates that lenalidomide sales through the Part D program represent a potential significant share of overall revenue growth for many generic manufacturers between 2022 to 2023. In other words, if manufacturers were making all of the revenues on lenalidomide themselves (not sharing any with wholesalers/pharmacies/PBMs/insurers or anyone else), then lowering their price on this ONE product within their catalog of products means they may decrease their revenues 10% to 80% based upon the figure above. If that’s true, then generic drug manufacturing represents an extremely fragile industry. If one product can skew your revenues by as much as 84%, then can you really afford to give up setting such an inflated price? Would you be able to supply the rest of your generic products with that hit? Note that Dr. Reddy’s has nearly 1,000 NDCs in their portfolio making up hundreds of different products. Do we really believe that Dr. Reddy’s whole windfall of revenue in 2023 was primarily a result of selling generic Revlimid?
Maybe. Maybe Not. The data can’t give us an answer other than to accept that it would is to recognize how fragile their overall operation is/was (83.6% dependent upon this one product line).
But with projected 2025 Part D revenue for lenalidomide exceeding $3.5B — surpassing the total global sales of most manufacturers Figure 34 (i.e., everyone but Teva, based upon their financial filings) — there is little incentive for these companies to lower prices or compete aggressively. In fact, maintaining high prices and limited competition within the Part D program may be a rational strategy to protect and maximize their revenue streams, especially given the outsized impact that this single product could have had on their overall financial performance.
Help us NADAC; you’re our only hope
Now that we come up with good ballparks of the costs incurred my Medicare and the unit prices, this would be the time where we show you what we think the actual underlying acquisition cost of lenalidomide is based our other data sources. It’s analysis we have performed time and time again here a 46brooklyn to size drug markups. Except, there are no observations of lenalidomide prices in NADAC. Recall that NADAC is a survey of retail pharmacy acquisition costs, and well, with a restricted limited distribution network comprised of non-retail pharmacies, there are no pharmacies to survey who can tell us what lenalidomide’s price really is. Sure, we can get signals that price is eroding. Look at the financial statements of Teva after generic Revlimid’s launch in 2022:
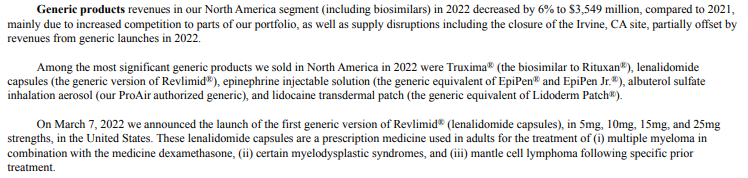
Figure 35
Source: Teva Pharmaceuticals 10-K
Compared to their statements in 2025:
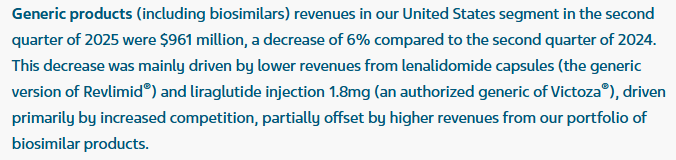
Figure 36
Source: Teva Pharmaceuticals
Indeed, at least some investors anticipate price erosion on lenalidomide.
Again, even if we think the generic manufacturers are making all of this money off this drug, we have observed that their revenue seems maybe dependent upon making money this way (a stretch of a statement to be sure, and likely not true as our analysis suggest — 80% of revenue from one drug seems unbelievable), but more to the point, they’re seemingly telling investors this drug is less and less reliable for them over time (this is our observation and not financial advice).
And while NADAC isn’t our only source of “real” drug pricing information, others also are lacking. Go to Mark Cuban’s Cost Plus Drugs and you’ll find no entry for lenalidomide. Again, there is a restrictive pharmacy network in place for lenalidomide and Cuban appears to be on the outside looking in.
It looks like our attempt to determine the cost and markup on generic lenalidomide has hit a wall.
So, the best we can do if we want to understand lenalidomide’s potential “real” price is to turn to the last drug high-cost generic drug we’ve mentioned in this report — abiraterone.
Abiraterone
Abiraterone is the generic version of Zytiga, a medication used in the treatment of prostate cancer. We so subtly began this report with a demonstration that abiraterone is a generic drug managed as a specialty pharmaceutical (if you can recall that far back). It is available in two formulations: 250 mg and 500 mg. The 250 mg formulation launched in November 2018, followed by the 500 mg formulation in December 2020. Both formulations are therapeutically equivalent, as explicitly stated by the brand manufacturer (Figure 37).
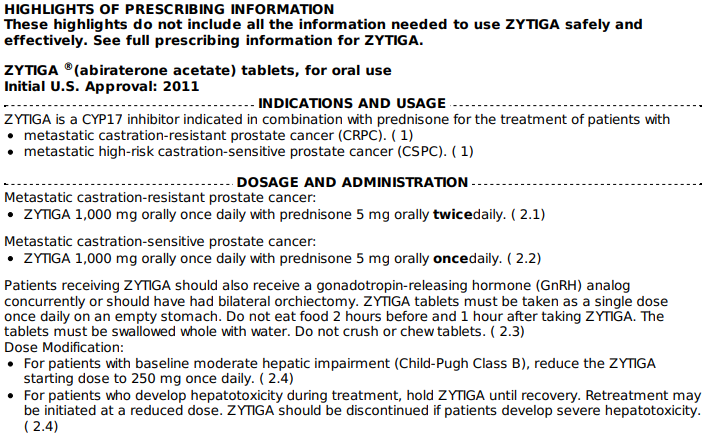
Figure 37
Source: Zytiga Highlights of Prescribing Information
This equivalence is important for understanding pricing dynamics, particularly since the 250 mg formulation has a longer price history and is associated with a publicly available NADAC benchmark.
Note: Our analysis relies on the Part D price by drug dataset, which aggregates all formulations of a drug into a single record by brand and generic status. Thus, the dataset does not distinguish between the 250 mg and 500 mg formulations of abiraterone, treating them as a single entity for pricing and utilization. PBM roles include managing formularies to optimize value, such as substituting two 250 mg tablets for a single 500 mg dose when cost-effective. Accordingly, our analysis focuses on the 250 mg formulation, leveraging its longer price history and NADAC data. We acknowledge that some PBMs may not fully capitalize on these price incentives, but we will provide scenarios that assume reported units may need to be doubled to reflect increased dosing for the 500 mg equivalency providing a worst-case scenario.
Telling Abiraterone’s Pricing History
Abiraterone 250 mg launched in 2018, with five generic labelers entering the market by year-end. At launch, the average generic WAC price was $51.94, compared to the brand’s $85.23 — a 39% discount (Figure 38). The average generic AWP was only an 8% discount to the brand’s AWP. This illustrates a key issue that should sound like an echo to our readers: although generic WAC prices dropped sharply, generic AWP prices remained much closer to the brand, and AWP is often the preferred benchmark for payer reimbursement (see our database of drug channel contracts for proof).
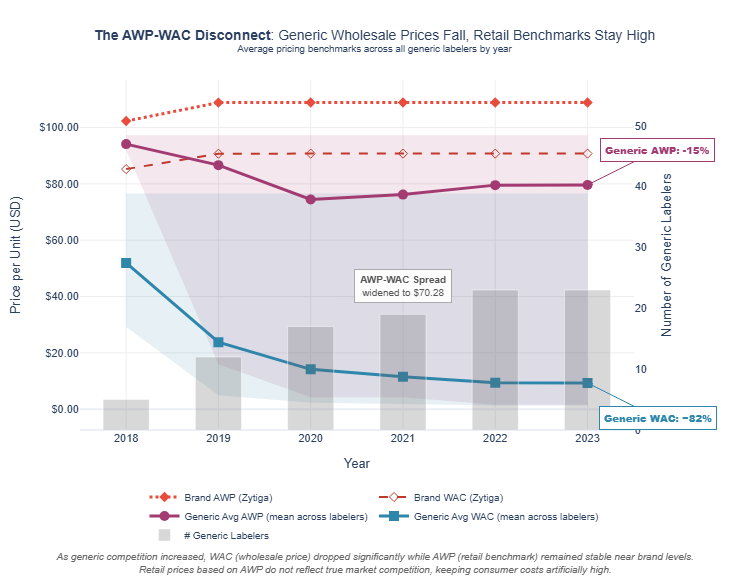
Figure 38
Source: 46brooklyn Research analysis of Elsevier Gold Standard Drug Database (GSDD)
By the end of 2023, the number of generic labelers had grown to 23. The average generic WAC had plummeted to an 82% discount from the brand WAC. However, the average generic AWP only declined to a modest 15% discount from the brand AWP. This persistent gap between WAC and AWP discounts means that, while manufacturers have significantly lowered list prices (WACs are the manufacturer list prices), AWP-based payment models may not fully reflect these reductions. As a result, payers relying on AWP-linked pricing guarantees (which is an overwhelming majority in our experience) must depend on PBMs to negotiate and apply appropriate discounts, a process that lacks transparency and may not always pass savings through to plans or patients.
A closer look at specific generic labelers in 2023 (Figure 39) highlights a striking trend: while most generic labelers have a WAC of $5.00 or less, their associated AWPs are typically above $90 (again, we cannot show you the actual numbers, so we graph the relationships between AWP and WAC, identify the AWP premium relative to WAC, and provide some guidance into what the actual numbers are).
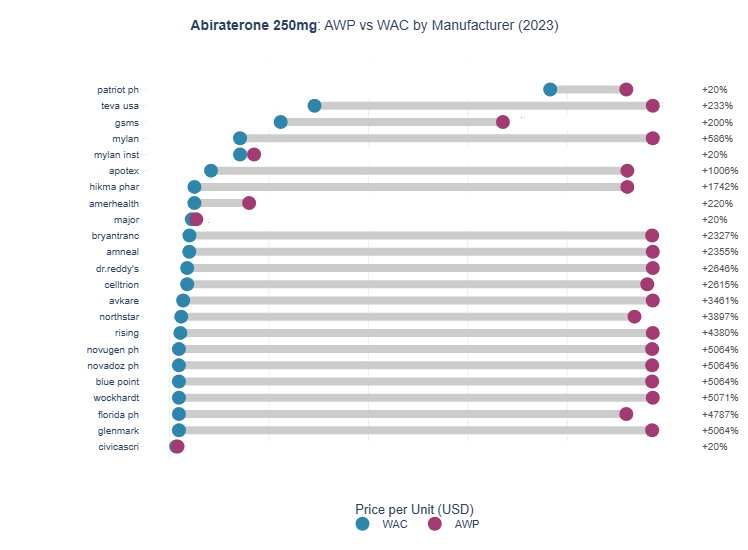
Figure 39
Source: 46brooklyn Research analysis of Elsevier Gold Standard Drug Database (GSDD)
Next, we compare this pricing information to the pharmacy acquisition cost data per NADAC. As shown in Figure 40, the NADAC for abiraterone was first established at $9.05 per unit in January 2020 — more than a one-third discount to that year’s average generic WAC and an 89% discount to the average generic AWP.
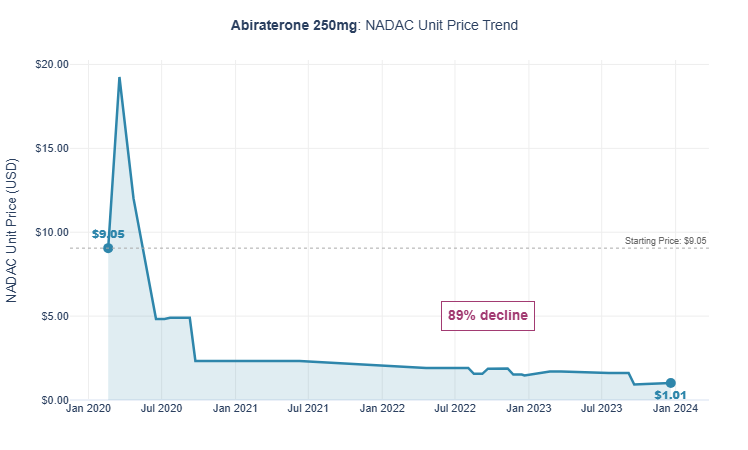
Figure 40
Source: 46brooklyn Research analysis of Elsevier Gold Standard Drug Database (GSDD)
By January 2023, NADAC had declined to just $1.57, while the average WAC in 2023 had only dropped marginally, and the average AWP actually increased slightly. Yes, you read that correctly: AWP increased over time (which makes sense if you think about the incentives). The addition of NADAC provides critical context that may not be apparent from WAC and AWP data alone. Furthermore, prices based solely on AWP or WAC (or discounts to those benchmarks) may appear to offer value but could leave substantial savings unrealized or gobbled up by drug supply chain intermediaries (a small percentage difference in a big number is potentially a lot of money at stake).
Note: Supply chain intermediaries are very diverse and include pharmacies, wholesalers, GPOs, brokers, PBMs, and other entities that generate revenue from the sale of prescription drugs.
Part D spending goes BOOM
With a clearer understanding of abiraterone pricing, we can now assess whether Part D spending aligns with reasonable pharmacy acquisition costs; meaning, if we know the actual cost of the drug, what kind of savings or premium is Medicare paying relative to that cost?
We have already established that the average Part D price per prescription for abiraterone in 2023 was $2,779 (Figure 19 previously). Figure 41 presents Part D spending for abiraterone alongside the benchmark data discussed above, focusing on abiraterone 250 mg.

Figure 41
Source: 46brooklyn Research analysis of Elsevier Gold Standard Drug Database (GSDD) and Medicare Part D Dashboard
Several key findings emerge. First, the total estimated WAC is $303.65M, while total Part D spend was $877.47M — meaning actual spend was more than double the manufacturers’ list price. While some of this spend may be attributable to 500 mg tablets (which are likely higher in cost), even if we adjust the data so the average units per claim is 120 (the typical 250 mg dose), the collective WAC only increases to $353.7M ((303.65M / 103 units) x 120 units). Medicare Part D doesn’t give us data at the NDC level, so we are left with an unknown distribution between the 250 mg and 500 mg strengths, but the overall amount should fall somewhere within the range we’re outlining. The most striking figure, however, is the NADAC value of Medicare prescriptions: $51.21M (or $59.7M when prorated to 120 units). This suggests that Part D may have paid $817.7M more than what the drug could have reasonably been acquired for no more than $59.7M. In other words, a prescription for 120 abiraterone 250 mg tablets with an average pharmacy acquisition cost of $188 was reimbursed at a whopping $2,779.
So how could this be? We have a clear data point, NADAC that shows we could be spending a lot less on this drug then we are actually spending. Even if we go back an entire two years to January 2021, the NADAC for abiraterone was just $2.32 (said differently, even if we used old data 2021 data in 2023 to price claims we still should have saved money). With two years of NADAC data (2021 to 2023), one would think that it would be possible to get pricing right in Part D for 2023 and by all accounts, Part D plans and their PBMs failed miserably? Or better yet, maybe they succeeded — just not the way taxpayers may have wanted. To uncover what’s really afoot, we will need to understand how abiraterone is largely classified within the drug delivery channels.
Abiraterone tiering
Abiraterone is a small-molecule drug used to treat prostate cancer. While the brand version (Zytiga) carries an average monthly cost exceeding $10,000 — leading to its classification as a specialty medication — the cost profile for the generic has changed dramatically. NADAC data show that, for at least two years prior to 2023, pharmacies’ average monthly acquisition cost for abiraterone was under $200 per prescription.
To determine whether Medicare Part D plans have updated their tiering in response to this price drop, we analyzed the 2023 Medicare formulary files (see Figure 42 below). We identified the formulary tiers assigned to abiraterone 250 mg across all plans and compared these to plan enrollment. The results show that nearly 60% of plans — representing 66% of enrollees — continued to classify abiraterone 250 mg as a specialty drug. An additional 9% of plans (covering 28% of enrollment) placed it on tier 4, the highest brand tier. In total, 94% of beneficiaries were exposed to pricing consistent with specialty or high brand tiers, despite the drug’s acquisition cost being well below the specialty threshold for two years.
Understanding the impact of this tiering requires reference to CMS guidance: in 2023, a specialty drug was defined as one with an average monthly price exceeding $830. In other words, as long as the reported price remained above this threshold, plans could justify specialty tier placement — even if actual acquisition costs are far lower (“Contract Year (CY) 2023 Final Part D Bidding Instructions,” n.d.).
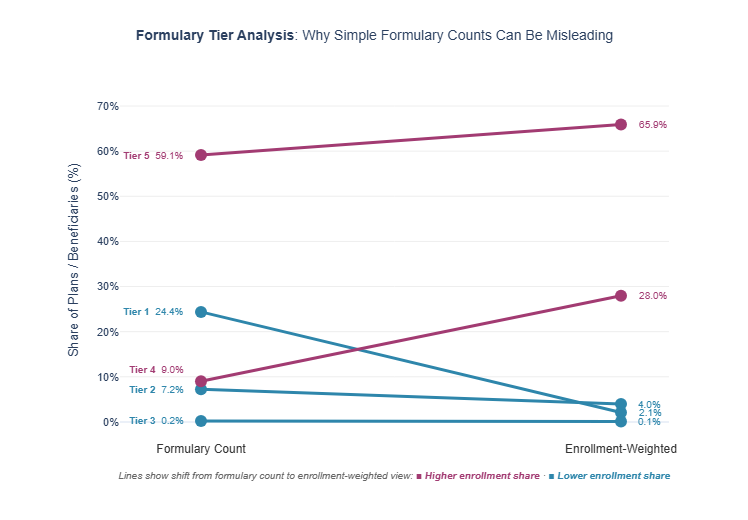
Figure 42
Source: 46brooklyn Research analysis of Medicare Formulary Files
Medicare is not alone (here’s looking at you commercial payers)
Abiraterone in the Part D program appears to be significantly mispriced compared to reasonable pharmacy acquisition costs. Our Part D analysis faces a key limitation: while profound mark-ups are obvious, we cannot distinguish between the 250 mg and 500 mg formulations to adequately and precisely say by just how much. To address this, we prorated our benchmarks to reflect a typical 500 mg dose. To further validate our findings, we examined public commercial pricing data from West Virginia and Georgia, two states that require commercial insurers to report drug transactions when reimbursed ingredient costs are greater than or less than 10% of NADAC (Note: each PBM has their own place where they report these so we cannot provide a simple link to these files). Both states report at the NDC level, but West Virginia provides greater detail by including the specific pharmacy who dispensed the drug and date of service, while Georgia reports only monthly NDC aggregates.
For the West Virginia analysis, we identified all NDCs associated with abiraterone 250 mg within one PBM (ESI) and calculated the average weighted unit price paid to each pharmacy. We then prorated these prices to reflect a typical 30-day supply (120 tablets) and determined each pharmacy’s share of total claims. Figure 43 presents the results: eight pharmacies dispensed abiraterone 250 mg in 2023, according to the PBM files we analyzed. The pharmacy listed suggests these prescriptions were filled within specialty networks, despite a reported NADAC of $1.57 per unit in 2023. Notably, Accredo alone received 48.7% of claims and was reimbursed at a rate 30 times the NADAC benchmark of $188 — roughly $5,475 above the estimated pharmacy acquisition cost for a 120-unit prescription.
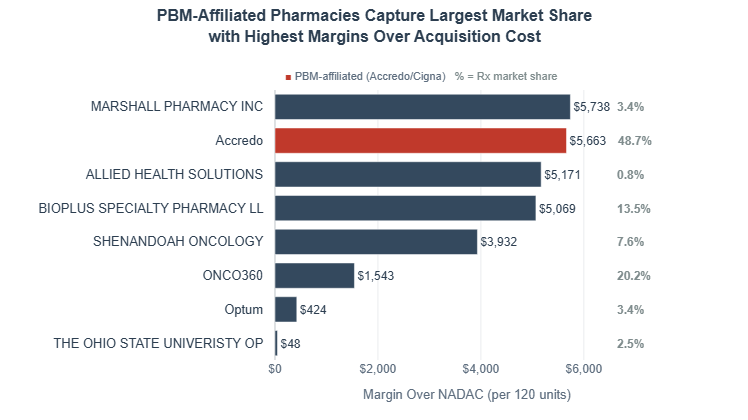
Figure 43
Source: 46brooklyn Research analysis of Evernorth Health Services National Average Drug Acquisition (NADAC) Reports - West Virginia 2023
We further sought to validate these findings using Georgia commercial data. Although Georgia’s data is less granular, it encompasses a broader range of payers. For this analysis, we aggregated transactions at the PBM level and calculated the average weighted unit price paid to each PBM. Prices were then prorated to reflect a typical 30-day supply (120 tablets), and each PBM’s share of total claims was determined. Figure 44 presents the results: five PBMs processed Abiraterone 250 mg claims in 2023. The Big 3 PBMs (CVS Caremark, Express Scripts, and Optum) are highlighted as red bars, representing over 75% of the total U.S. PBM market share. While PBMs are expected to leverage their market power to negotiate better pricing, the data show that two of the Big 3 (CVS Caremark and Express Scripts) paid 15 to 30 times the NADAC benchmark. In contrast, the smallest PBM, MedImpact, paid only slightly above NADAC.
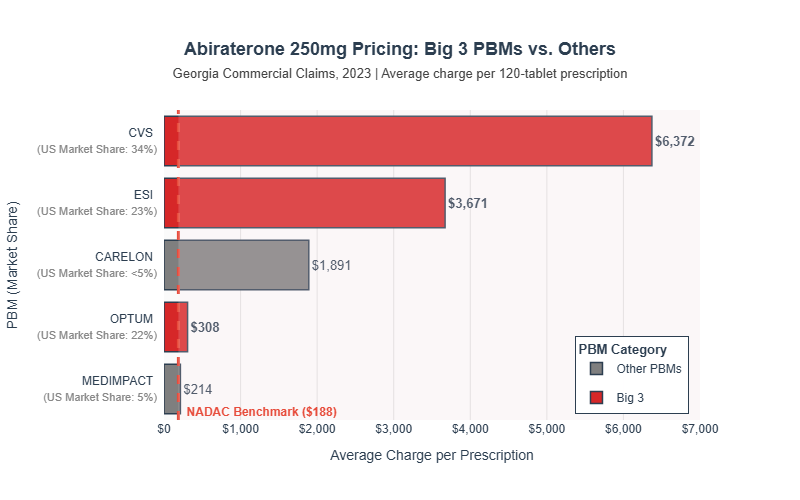
Figure 44
Source: 46brooklyn Research analysis of Caremark Georgia NADAC Reports-2023, Evernorth Health Services National Average Drug Acquisition (NADAC) Reports - Georgia 2023, CarelonRx State Disclosures - Georgia 2023, OptumRx Georgia In-Network Provider NADAC Reports - 2023, and MedImpact State Regulatory Requirements, GA NADAC 2023.
Georgia commercial data requires reporting whether a claim was filled at a PBM-affiliated pharmacy. Of the PBMs with available data, only one (Express Scripts, ESI) flagged affiliate claims. We conducted a sub-analysis comparing the average weighted unit price paid to ESI-affiliated pharmacies versus non-affiliated pharmacies, prorating prices to a typical 30-day supply. On average, ESI affiliate pharmacies were reimbursed $2,756 more per prescription (a 105.9% premium) than non-affiliate pharmacies (see Figure 45).
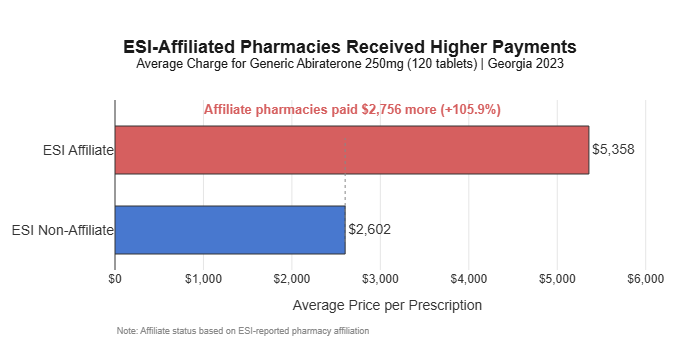
Figure 45
Source: 46brooklyn Research analysis of Evernorth Health Services National Average Drug Acquisition (NADAC) Reports
Abiraterone in Medicaid
Lastly, we examined Medicaid rates using the Medicaid State Drug Utilization Data (SDUD), which reports claims at the NDC level by state and quarter. This granularity allowed us to isolate abiraterone 250 mg claims and benchmark average actual spending (“Medicaid Reimbursement”) against the weighted average NADAC, WAC, and AWP for 2023. As shown in Figure 46, Medicaid reimbursed an average of $1,105 per 120-tablet prescription in 2023 — $967 above the NADAC benchmark ($138), $770 above the average WAC ($335), and a discount of $10,398 from the AWP ($11,503). These findings indicate that, even in Medicaid — where pricing is typically more tightly controlled — abiraterone 250 mg is reimbursed at rates far exceeding reasonable acquisition costs.
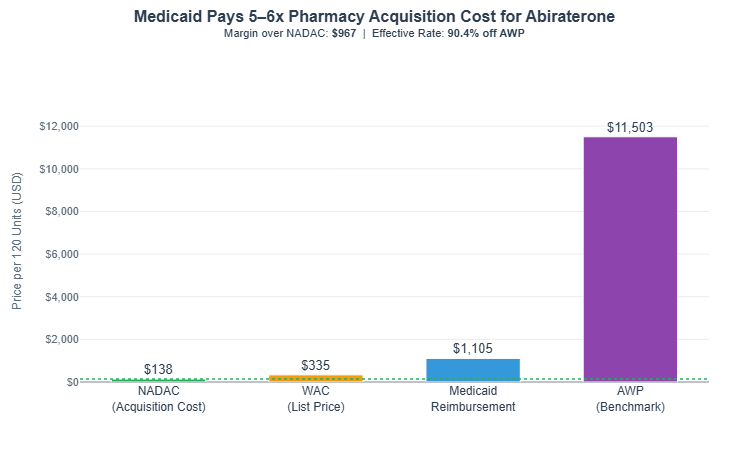
Figure 46
Source: 46brooklyn Research analysis of Medicaid State Drug Utilization Data (SDUD)
Abiraterone 250 mg, despite being a generic, remains dramatically overpriced across Medicare Part D (Figure 41), commercial (Figures 43, 44, & 45), and Medicaid (Figure 46) channels. In Part D, the average prescription cost in 2023 was $2,779 — over 14 times the typical pharmacy acquisition cost (NADAC) and more than double the manufacturer’s list price (WAC). Most plans continue to classify abiraterone as a specialty drug, even into 2026, exposing nearly all beneficiaries to high-tier pricing, even though the acquisition cost has been under $200 per month for two years (Figures 4 through 10 previously).
If we use abiraterone experience as our guide for understanding lenalidomide the experience, well, we’re not going to like what we find. In 2023, our conservative estimates are that Medicare spent $500 million more on abiraterone then it might otherwise have expected to spend (Figure 41) based upon typical generic drugs deflating rapidly in price (to be clear, NADAC shows it deflated, Medicare reimbursement shows that it did not). We “only spent” $877 million on abiraterone in Medicare to produce this $500 million, and we spent double that on lenalidomide. So we assume that for just two drugs, Medicare spent $1.5 billion more then their actual cost per year (or $15 billion over 10-years to put the number in CBO lingo). That seems a lot, particularly with most of that money not going to retail pharmacies, but to a select group of mostly PBM-affiliated pharmacies.
Putting this another way, consider the following images which compare a universe of various pricing observations for abiraterone and lenalidomide (Figures 47 & 48).
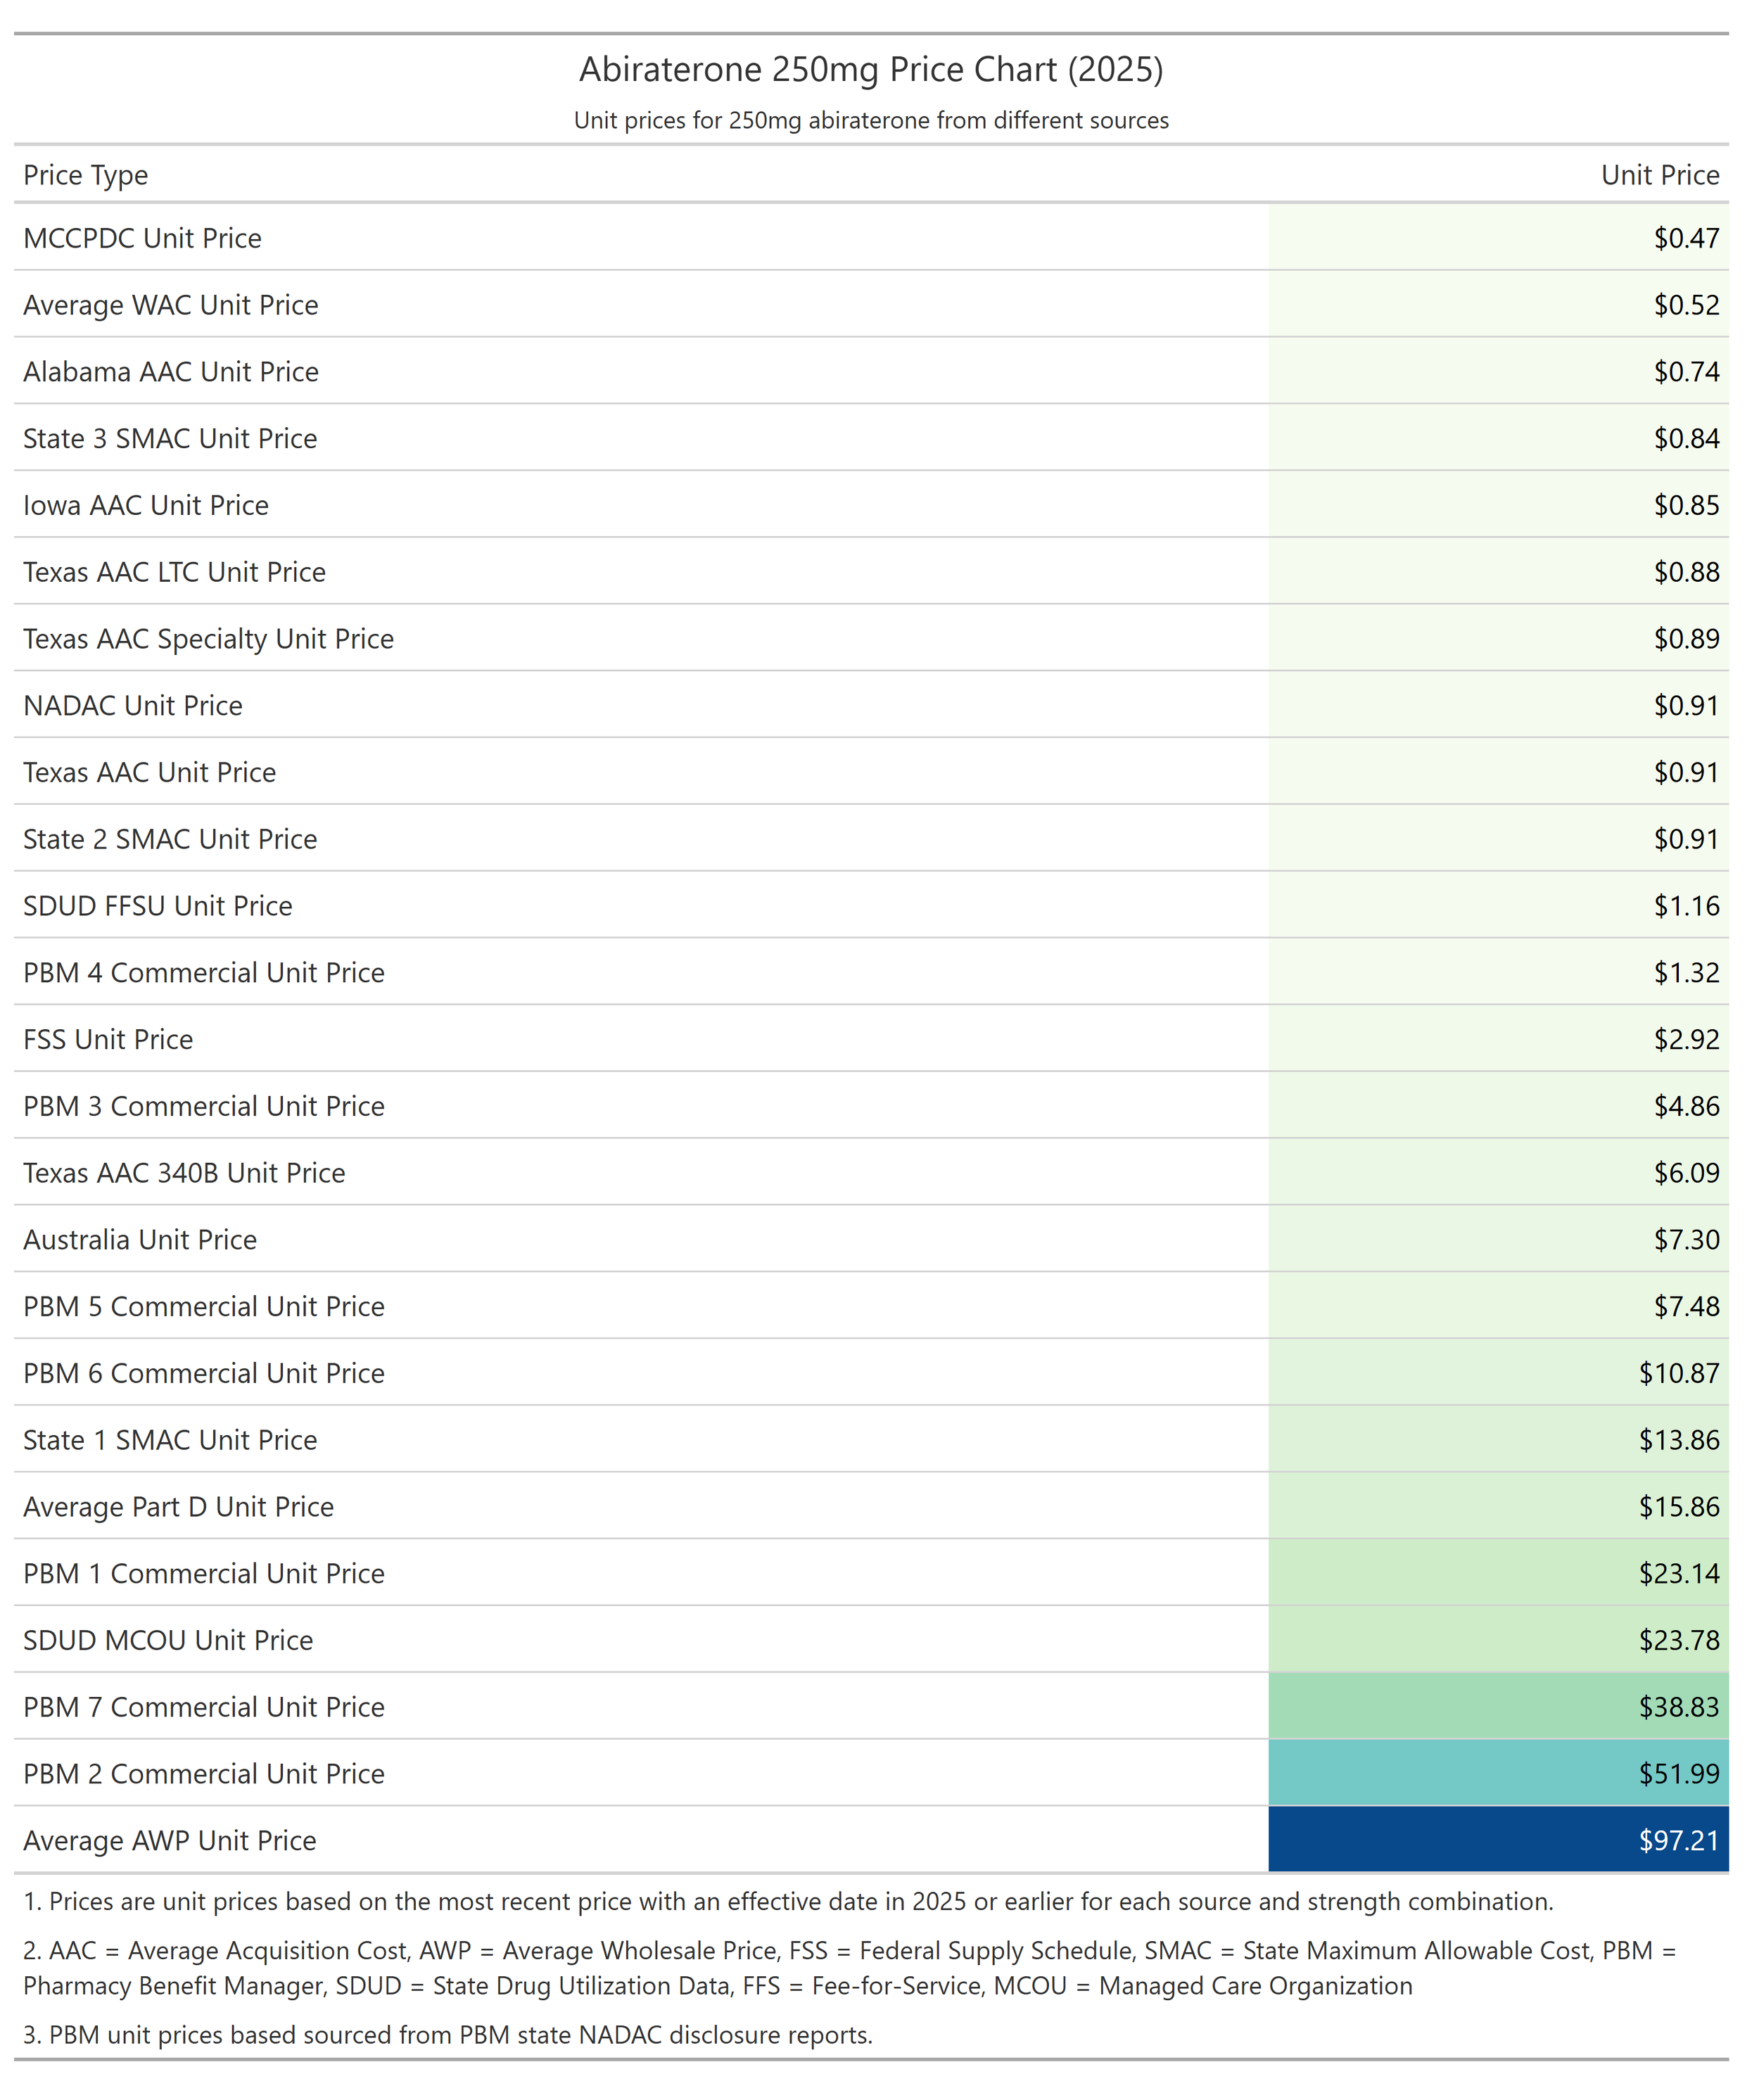
Figure 47
Source: 46brooklyn Research analysis of multiple drug pricing benchmarks
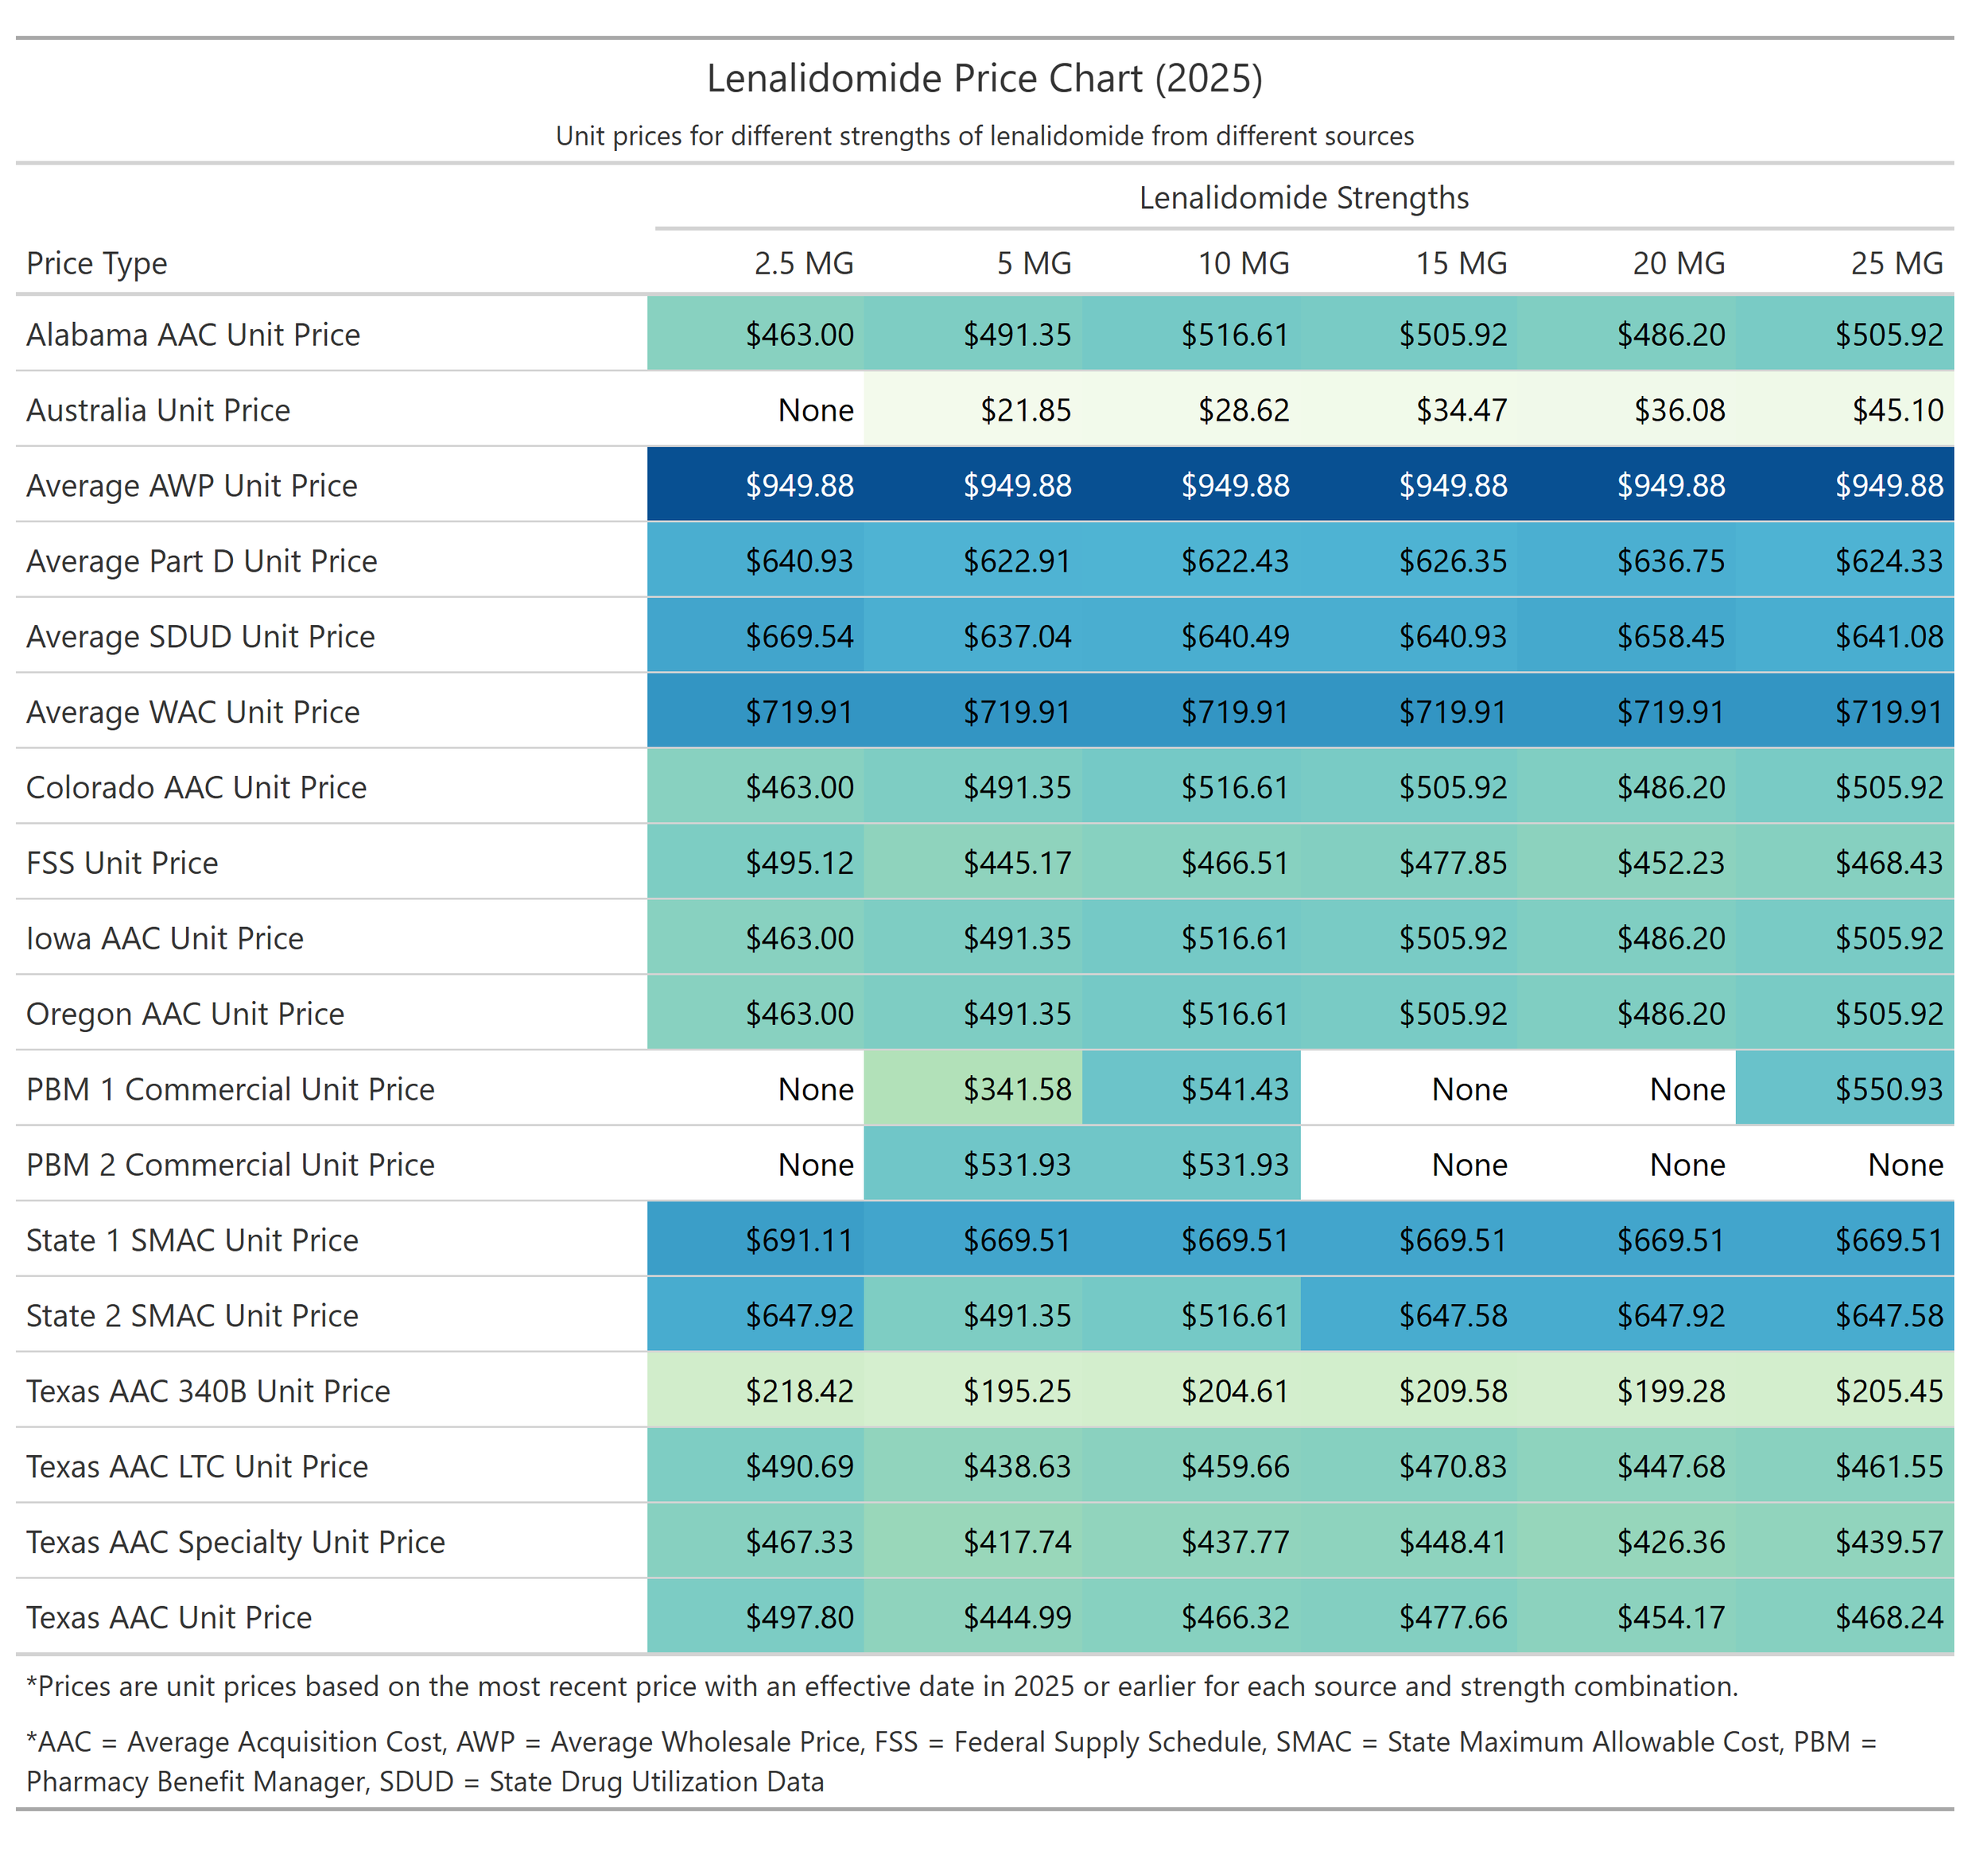
Figure 48
Source: 46brooklyn Research analysis of multiple drug pricing benchmarks
Perhaps these charts, more than anything else we’ve written and analyze here, can help put into focus what we mean when we say that when there are a dozen different prices for things, there is effectively no price for these things. If you were a cancer patient and needed one of these drugs to treat your disease, which price do you hope the PBM exposes you to and what sort of assurances would you want to ensure that you’re price wasn’t high so someone else’s could be low?
How is it that a drug like abiraterone can be sold by Mark Cuban for less than 50 cents, while a PBM in the commercial market is selling it for $50 more? Even if we multiplied the Cuban price by four to get closer to the ballpark pharmacy acquisition costs and costs to dispense of around $2 per pill, over the course of a year, one patient’s therapy could come at an $72,000 premium versus what a sober, aligned marketplace is already yielding.
How is it that a drug like lenalidomide can have be purchased by pharmacies for around $460 per capsule, but Medicaid and Medicare programs are being charged around $630 for the same product? What justification is there for an annualized markup of over $46,000? What exactly is the “special” service that necessitates such a premium? Maybe instead of looking at PBM specialty designations as some title of esteem for the drug itself, we should be looking at it through the lens of the entity conveying the title in the first place. Maybe it’s not that the drug is uniquely special, but that the profit opportunity is.
We are all doomed
So now for the part where we sound like a broken record (repeating a point we’ve made before but with just new evidence around it) — why would our expectations regarding any of these pricing dynamics reviewed today be any different? If you’ve been following 46brooklyn’s work for any length of time, how is the story today different from the story we launched with on imatinib mesylate, or our Copaxone report, or our Tecfidera report, or any of the countless pieces we’ve put together on the irrational and disconnected nature of U.S. drug pricing? Today’s story is different only in the details, but the overall theme is the same (lower prices are not incentivized and so lower prices are not recognized). When Civica launches the lowest price version of abiraterone by all objective drug pricing benchmarks into the market, why do they struggle to make sales? When Mark Cuban does the same with albendazole, why is the outcome also a rejection from the legacy drug channel as a whole?
The outcomes of taking 4% of overall generic drug spending (i.e., Medicare lenalidomide in 2023) and directing it to a select few pharmacies seem obvious to us — enrichment for a select few and pharmacy headwinds and closures for many.

Some will shrug and call it a sign of the times for pharmacy. We call it something else: a market with fundamental flaws that no amount of "efficiency" hand-waving can explain.
Efficient? What's efficient about turning a $90 drug into a $12,000 drug (abiraterone)? Secret bids and secret prices benefit the plans — really? And even, granting that, even if we've stumbled onto cherry after cherry until an orchard grew around us, one fact remains: nobody can explain how this price discrimination actually works. Who picks the winners and losers? Why is it cancer drugs like abiraterone, imatinib or lenalidomide that get inflated most?
Picture the welcome letter: "Congratulations — you have prostate cancer. You've been selected to cross-subsidize a stranger's cholesterol pills so they’ll be cheaper. America thanks you for your service. (Void if you know the secret handshake at Civica or Cost Plus Drugs.)"
Nobody signs up for that. Nobody could. Is an ERISA plan knowingly taking a worse price so someone else gets a better one? That's the story we're asked to believe — and it raises more questions than it answers (and we suspect not one that any plan will agree to answer in the affirmative).
No. Here's what's actually happening: until we decide what we want drug pricing to do, the people holding the pricing secrets will make it do what they want.
Based upon the cherries we’ve found, are we sure that's what we want?