
How PBMs can use private-labelled drug products as a great escape from anti-steering policies
Across every corner of U.S. healthcare, from end-of-life care to reproductive rights, patient choice sits squarely in the middle of many health policy questions. From a certain point of view, patient choice can be viewed as the DNA strand connecting America’s ever-expanding, ever-adapting, healthcare ecosystem. And much like John Hammond or Curt Connors, when you mess with DNA, you face ethical quandaries. Advocates for patient choice highlight that patient autonomy is a moral right: the freedom to make informed, deeply personal choices about one’s own body. Payers and policy wonks, however, point out that limitless choice can drive up costs, fracture care coordination, and dilute quality. The result is a perennial push-and-pull: for each new reform — telehealth expansion, value-based payment, tightening or loosening of drug formularies — lawmakers and stakeholders must decide, much like Hammond’s Jurassic Park engineers, exactly how much control to resurrect and how much to place behind an electric fence.

In practice, lawmakers often try to balance the freedom to choose “any willing provider” with the economic realities of containing healthcare spending and ensuring equal access to care. In the private market, plan sponsors weigh similar trade-offs in attempting to curate their plan designs (to the degree with which they even realistically can). The end result is that regardless of the healthcare topic debated, patient choice seems to come up – as a rallying cry and/or negotiating chip that warps part of the policy discussion around its perspective. These debates over degrees of choice and coverage are directionally healthy – just like we can’t pay infinite dollars for healthcare, we also can’t pay nothing either. Thus, the field of play is ultimately centered on this friction between the patient’s value assessments for their own care versus the plan’s value assessments for controlling investment in care.
As a starting point, consider that Medicaid, under federal law, states that beneficiaries may obtain medical services "from any institution, agency, community pharmacy, or person, qualified to perform the service or services required . . . who undertakes to provide him such services." (Section 1902(a)(23) of Title XIX of the Social Security Act (the Act)). This provision is often referred to as the "any willing provider" or "free choice of provider" provision and extends from sea-to-shining-sea in the United States.
Alternatively, consider that as early as 1987, the Arkansas legislature passed Act 489. Generally considered the first pharmacy-specific “any willing provider” law adopted by a state, the act states that employers and insurers may not require mail-order pharmacy usage nor impose cost penalties for using local pharmacies. The Arkansas act triggered a wave of copycat bills throughout the early 1990s. Perhaps for that reason, when Medicare Part D came about in the mid-2000s, it also included a requirement that Part D sponsors must let any pharmacy that meets the plan’s terms to join the retail network (see §1860D-4(b)(1)(A)).
An increasing number of states have enacted policies that attempt to prohibit a plan or pharmacy benefit manager (PBM) from forcing a patient to use a specific pharmacy or using cost-sharing penalties to nudge them to that specific pharmacy. By our unscientific count of this list from the National Conference of State Legislatures (NCSL), we tally just under 20 states with some form of “patient steering” extinction laws on the books.
And then of course, there’s Arkansas (again), whose governor Sarah Huckabee-Sanders sent shockwaves nationally this year when she signed a law that essentially destroyed the PBM’s ability to steer to patients to affiliated pharmacies simply by prohibiting PBMs from owning pharmacies at all in their state. The policy faced steep PBM opposition, who are now suing over it.
While true legislative intent can be speculated, in general, it is our opinion that the main premises of the first-in-the-nation Arkansas law are built on maximizing patient choice, eliminating conflicts of interest, and reducing costs (as PBM-affiliated pharmacies often receive higher estimated margins than their non-affiliated peers). Regardless, it is also our informed opinion that when state governments enact policies, they expect those policies to be followed in accordance with the intent.
With this legislative track record – and despite the fact that PBM executives have testified that they don’t steer – patient steering issues still arise in states. Recent legislative efforts like those of Iowa highlight this. Iowa’s latest PBM legislative activity would restrict common activities of payers and PBMs by removing the ability to require medications, like specialty drugs, to be dispensed at payer and/or PBM-affiliated pharmacies. As way of example, consider this PPO 800 plan from Express Scripts for Dell. As stated on page 1, specialty medications must be ordered through the PBM-affiliated Accredo pharmacy in order to receive coverage (Figure 1):
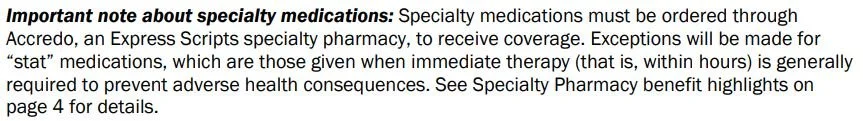
Figure 1
Source: Express Scripts
In other words, if Dell members don’t want to pay the full price for specialty medicines (think thousands to tens of thousands of dollars) by using the pharmacy of their choosing, they’ll use Accredo or go without the benefit of their healthcare coverage to get them (unless they’re in Iowa or other states with similar policies). So following the train of logic of the PBM executives who testified in Congress last year, it’s not Express Scripts that is forcing patients to use Accredo for specialty drug coverage; but instead, it was Dell that had the idea to require their employees to use Accredo instead.
While the whodunit of it is fun and all, from a practical standpoint, pharmacies that attempt to fill prescriptions where payers and/or PBMs have put in-network restrictions are often greeted by messages like “Rejection Code AD: Billing Provider Not Eligible To Bill This Claim Type” or “Reject Code 76: Plan Limitations Exceeded” with a secondary message that details which specific pharmacy is eligible to dispense the medication. If effective, these state-level anti-steering laws would reject the use of those PBM reject codes for the purposes of requiring the medications be filled at a specific pharmacy.
But if you’re familiar enough with PBM policy dynamics, you’ve probably heard the phrase “whack-a-mole” before, which is often used to explain the adept ability the industry has in working around the intent of legislation. Or maybe we should pin that on the plan sponsors too?
We learned this whack-a-mole dynamic the hard way in Ohio after the 2018 spread pricing saga unfolded. Unsurprisingly, legislative attempts to restrict PBM steering have also faced allegations of non-compliance (see Georgia for example).
You can’t just suppress 65 million years of gut instinct.
Regardless of whether state anti-steering laws are good or bad, or currently working as intended or not, yet another tale as old as time has re-emerged: PBM vertical integration may provide yet another possible sanctuary to maneuver around the intent of state laws. And this time, the drug channel may be unearthing what many considered long-extinct remnants of a time long-forgotten where giant drug companies roamed the planet and intermingled DNA with their former foes in the PBM sector.
In today’s drug pricing report, we explain how the advent of PBM private-label products – where PBM-affiliated companies essentially get in the pharmaceutical manufacturing and price-setting game – turn back time in a way that could represent a conveniently timed end-around of mounting anti-steering legislation while maintaining the interests and incentives of PBMs to disproportionately provide highly marked up medicines to their affiliated pharmacies.
Welcome to Private Label Park.
PBM private labels: “We can make it if we run.”
Private-label pharmaceuticals are medicines whose chemistry, dosage form, and FDA-mandated labeling text mirror a reference drug, but the bottle or carton carries a different National Drug Code (NDC) “labeler” prefix. Think of it like store-brand, sugar-coated corn flakes rather than name-brand Frosted Flakes. Historically, these store-brands were principally relegated to over-the-counter items available at the likes of Walmart, Target, or others.
Recently, PBMs have started to adopt their own “house brand” logic to pharmaceuticals by creating offshore subsidiaries that buy FDA-approved products in bulk, wrap them in exclusive labels, and then prefer those products on their own formularies. For the historians in the room, this is basically the inverse of what happened in the 1990s with PBMs (where drug manufacturers were buying up PBMs; see Merck-Medco merger as example). Now PBMs are themselves becoming drug manufacturers. Said differently, private-label NDCs are the velociraptors testing the park’s electric fences — probing for weaknesses in any willing provider and anti-steering laws. Consider the following regarding each of the big 3 PBMs:
PBM: Express Scripts | Parent Company: The Cigna Group. Formed in 2021 and domiciled in the Cayman Islands, Cigna’s affiliate Quallent Pharmaceuticals started with commodity generics but evolved in 2024 to specialty biosimilars. In their own words, “the mission of Quallent Pharmaceuticals is to bring greater quality consistency and stability to our global pharmaceutical supply chain.“ While these private label arrangements can present a conflict of interest of sorts, it can also be true that private labelling can be a mechanism to lower the prices of drugs or shore up supply of medicines in the event of broader unavailability. On the latter point, for Cigna/ESI, we should acknowledge that of their list of 50+ available medications on Quallent’s website, at least five products have seen FDA recalls (from other manufacturers of those drug products), and another five have seen FDA shortages since 2020 (i.e., the year before Quallent was founded). These are as follows:
Metformin ER recall
Lamotrigine recall
Losartan recall
Gabapentin recall
Pravastatin recall
Hydroxychloroquine shortage
Sertraline shortage
Tacrolimus shortage
Capecitabine shortage
Imatinib shortage
If you are a loyal 46brooklyn reader or a fan of Federal Trade Commission reports on PBMs, you might recognize this list as somewhat of a greatest hits album. Across the board, in our archives, you can find a bevy of information about metformin, lamotrigine, losartan, gabapentin, pravastatin, sertraline, tacrolimus, and capecitabine. And of course, who could forget imatinib and hydroxychloroquine, which were literally the first two reports we ever published here at 46brooklyn.
PBM: CVS Caremark | Parent Company: CVS Health. Launched in 2023 and headquartered in Ireland, CVS Health’s Cordavis co-develops biosimilars with manufacturers. In their own words, “Cordavis makes strategic investments to bring pharmaceutical products to the U.S. market to increase competition and lower costs.“ Of course, from a WAC pricing standpoint, cheaper adalimumab products do exist to those offered by Cordavis (Figure 2).

Figure 2
Source: Drug Channels Institute
While Cordavis’ initial splash involved its Humira biosimilar, Hymiroz, this year, they have expanded its strategic biosimilar portfolio by wading into the Stelara biosimilar war with Pyzchiva.
PBM: Optum Rx | Parent Company: UnitedHealth Group. Trademarked in 2024 and also based in Ireland, Nuvaila (sometimes also referred to as Optum Health Solutions), which is part of the UnitedHealth Group conglomerate (legend has it that if you say their name in a public forum, they may magically appear), is a “pharmaceutical commercialization business” that seeks to ensure a reliable supply of therapies, create a strong supply chain, and uncover opportunities to reduce cost (per their website).
In addition to their Humira biosimilar, Optum/Nuvaila is also in on the Stelara biosimilar battlefield as well.
So, in quick summation, Quallent, Nuvaila and Cordavis are here to help secure robust supplies of pharmaceuticals and reduce costs (Quallent does not appear to explicitly say reduce costs on its website like Nuvaila and Cordavis do).

“You are acting like we are engaged in some kind of mad science, but we are doing what we have done from the beginning.”
What we find interesting is that armed with these private label products – regardless of whether these arrangements can provide savings versus alternative arrangements or not – PBMs are positioned to pursue steering of products to their affiliated pharmacies without likely running afoul of the letter of anti-steering laws. This is because they can secure for themselves the sole-source position of these specific drug products, place them on formularies that their own vertically-integrated company creates, and then require that the specific NDC must be selected in order for the claim to adjudicate within the pharmacy network that their own vertically-integrated company creates as well.
In essence, the limited availability of a specific NDC of a drug product at PBM-affiliated pharmacies (as the entities who can be solely able to purchase the product) results in steering to the PBM-pharmacy without overtly or directly restricting the sale of the medication at a specific pharmacy (at least that is our understanding, as we have yet to see evidence of products produced through Cordavis or Quallent being dispensed to any material degree at any pharmacy but those affiliated with the vertical company [CVS Health and Express Scripts/Cigna respectively]).
Conceptually, preferring one NDC of a drug versus another can be a reasonable strategy to ensure a plan is covering the most cost-effective therapies that are available and pushing out the ones that aren’t. If there are two NDCs of the same interchangeable product, but Product A has an average wholesale price (AWP) per unit of $1,000 and Product B has an AWP per unit of $500, an aligned PBM may deploy utilization management tools like an NDC exclusion to ensure that Product A is excluded from coverage, Product B is preferred, and thus the plan could maximize savings if paying at a commonly-utilized AWP-based discount (e.g., AWP - 85% will produce a lower net cost on the $500 Product B vs. the $1,000 Product A).
These types of PBM tools are commonplace. As of 2021, IQVIA found that “compounded year-over-year annual growth for NDC exclusions has been greater than 50 percent, with more and more brands facing blocks every year.” On the public program side, Medicaid programs have used NDC-based allowances or restrictions on their formularies for years. See Ohio Medicaid’s current formulary, where specific generic epinephrine products are preferred or restricted based upon the NDC-code (The labeler codes highlighted represent the first five digits of the NDC on the claim; so epinephrine with a NDC 49502-****-** will process as an approved claim, whereas others will not):
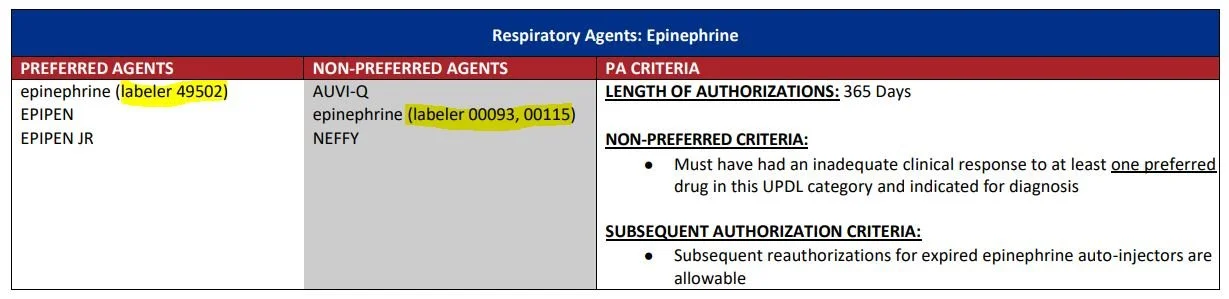
Figure 3
Source: Ohio Department of Medicaid
Of course, commercial and Medicaid programs are generally not engaged in directly purchasing and sourcing these labeler products, and participating network pharmacies can generally access the products their payer base is asking them to dispense. So the question becomes what, if any, financial advantage may be gained from these private label products. As a particular concern at the outset is that if you’re the entity setting the formulary – who can impose NDC-specific restrictions to products only you can source (i.e., your own private label products sourced to ensure you have a robust supply of medication) – well, then you better be sure that your pricing of those products makes reasonable and rational sense.
"'Ooh, ahh.' That's how it always starts. But then later, there's running and screaming."
Much has been made of the PBMs’ private label products of biosimilar Humira and Stelara. Humira was the top selling drug by revenues of the last decade, with Stelara up there in the mix as well. But biosimilars for those products didn’t really start to gain traction until the last year (which makes retrospective analysis difficult, as we don’t always have data readily available from stuff that recently transpired). For example, Medicare only just published its data through 2023, and groups like CVS didn’t really adopt biosimilar Humira until April 2024. But let’s see what we can make of the data we have, thanks to information in the public domain for Medicare, Medicaid, and the Commercial markets.
Medicare
Using Medicare as a judge, according to the 46brooklyn Medicare Part D Dashboard (which essentially a more souped up version of CMS’s dashboard) for 2023, the products of Humira and Stelara represented $9 billion in gross expenditures (out of $275 billion in total gross expenditures). If the big 3 PBMs manage approximately 80% of all prescription volumes (it’s more when you consider their rebate aggregator alliances), the private label strategy stands to be worth billions of dollars annually (80% of $9 billion is $7.2 billion). Assuming that PBM private label products provide an 80% discount on historic spending (an approximation of what Figure 2 is showing via list prices), then you’re looking at ~$5.7 billion in an addressable market for the private label products annually for Medicare (caveats include an assumed flat utilization of products which may not be likely as price decrease and number of individuals enrolled in Medicare grows).
However, while we will wait to see how Medicare adoption of these PBM private label biosimilars play out over the coming years (we estimate that it will be until May 2026 until we see Medicare’s 2024 utilization data), we can get an early insight into potential PBM private label activities by evaluating Quallent Pharmaceuticals. Why? Because Quallent has been around the longest (since 2021) and actually has utilization in Medicare in both 2022 and 2023; so we can monitor what the growth of PBM private label products might look like based upon what we can see in public data that is tagged to Quallent.
According to the Medicare Part D Dashboard, Quallent Pharmaceuticals had no utilization of any products in Medicare in 2021. In 2022, the dashboard shows that Quallent products were used to fill 1,991,271 Medicare prescriptions at a value of $42.8 million, whereas in 2023, Quallent products were used to fill 5,262,100 Medicare prescriptions (+164%) at a gross cost of $129.9 million (+204%) (Figure 4). That amount of growth is impressive.

Figure 4
Source: Medicare Part D Dashboard
In researching, of the 900 or so drug labelers in the Medicare Part D Dashboard, only 64 matched or exceeded Quallent’s level of prescription utilization growth, and only 59 matched or exceeded Quallent’s level of spending growth. If we rank those matching or exceeding Quallent’s dollar growth percentage by the total gross Medicare dollars spent in 2023, we see that only three actually had more gross spending than Quallent (Figure 5).

Figure 5
Source: Medicare Part D Dashboard
In other words, just because your spending increases 312%, it isn’t that meaningful if your $368 in 2022 increases to $1,517 in 2023 (see Prugen Pharmaceuticals in Part D 2023 Dashboard as an example). To us, these initial results signal that there is definitely something worth exploring in Medicare, as Quallent appears to quickly becoming one the prominent players in the drug manufacturing and labelling industry.
While Quallent offers 50+ products according to their website, the Medicare data suggests that 43 products were utilized in Medicare in 2023. The total expenditures on these 43 products across all labelers (Quallent plus other manufacturers of interchangeable versions of those drugs) was a gross $10.5 billion in Medicare throughout 2023. To pause here for a moment, we find this impressive by itself considering that these products represent a similar addressable market to what we already highlighted with Humira and Stelara (these 43 products have gross Medicare spending similar to the combined Humira and Stelara market within the program). In other words, while the other PBMs are catching up to Cigna/ESI’s private label endeavors, Quallent may have already carved itself a T-Rex-sized territory of private label products equal to the Humira/Stelara market that the PBMs are getting all the attention for right now.
On a per unit basis, 23 of the 43 products Quallent offers had a higher unit price than all the aggregate unit prices of all other labelers for that product in Medicare in 2023. As way of example, the average 2023 unit price for imatinib mesylate in Medicare for Quallent products was $103 per pill (Gross Medicare 2023 Expenditures / Number of Dosage Units), whereas the unit price for imatinib mesylate for all non-Quallent products was an aggregated $40.41 per pill (ranging from $2.31 per pill to $60.96 per pill; see Figure 6).

Figure 6
Source: Medicare Part D Dashboard
Alternatively, 17 of the 43 products showed that the Quallent unit price was cheaper than the competitors (meaning three products were effectively a wash). As way of example, the average 2023 unit price for aripiprazole in Medicare for Quallent products was $0.39 per pill, whereas the unit price for aripiprazole for all non-Quallent products was $2.52 per pill (range from $0.15 per pill to $23.50 per pill; see Figure 7).

Figure 7
Source: Medicare Part D Dashboard
Whether Quallent products were associated with savings or not largely depended upon which product we chose to look at, which if we’re honest, isn’t really a satisfying answer. If, as large PBMs claim, they’re the only ones working to lower prescription drug prices, we would expect them to have lowest price in all instances – or at least close to the lowest price – given their size and leverage. After all, by launching their own private labels, they’ve effectively taken over the role of who they say is to blame for high prices: the pharmaceutical company. And as PBMs like to remind us, the drug manufacturer and the drug manufacturer alone sets the drug’s price; so when PBMs enter the manufacturing and price-setting realm as private labelers, why aren’t their prices materially lower across the board? Or are the plan sponsors to blame for setting the prices of their drugs too?
Taking imatinib as an example, Mark Cuban in 2023 was able to provide a year’s worth of imatinib for approximately $560 in 2023 (or roughly the cost of six imatinib pills from Quallent per Medicare’s spending data; i.e., less than one week’s worth of medication). How could Cuban’s Cost Plus Drugs be doing so much better of a job managing imatinib costs in 2023 than the titanosaur of pharmacy benefits Express Scripts?
Well, to evaluate whether Quallent prices were net good or net bad, we decided to perform an analysis that evaluated what would happen to Medicare expenditures if the Quallent unit price prevailed for all units of the various products at issue in Medicare in 2023. To do this, we took our calculated unit price for Quallent and determined its premium relative to the calculated unit price for the aggregated experience of all other non-Quallent labelers in Medicare in 2023. In the below chart, if Quallent was more expensive, the value appears as a positive premium, whereas if Quallent was less expensive than the aggregate Medicare experience, then the value shows a negative. We then multiplied this calculated premium value by all Medicare units dispensed in 2023 to get the net impact to Medicare. As shown in Figure 8 below, if Medicare’s prices for all the drugs that were available through Quallent in 2023 were to effectively be changed to Quallent’s prevailing prices at the time, Medicare’s expenditures would rise around $1.2 billion, or 11% on Medicare’s $10.5 billion gross expenditures on those medicines from 2023.

Figure 8
Source: Medicare Part D Dashboard
The figure above suggests that, left to make their own drug pricing and sourcing decisions, PBMs (and/or their plan sponsors) would see Medicare pay them more, not less, for prescription drugs (at least, if Quallent’s pricing is to be the measuring stick). To be clear, we don’t think this is a surprising finding. PBMs after all are businesses, just like every other layer of the drug channel, and businesses want to be paid more; not less. From a certain point of view, perhaps this analysis supports the view that it is the drug manufacturer’s fault that drug prices are so high, as the PBM-affiliated manufacturer product lines seem to prefer/set/favor/effectuate (or whatever other word you’re comfortable with) higher prices; not lower (at least in the aggregate). Said differently, if Quallent wasn’t a labeler for imatinib prescriptions in Medicare 2023, odds are good that the Medicare member and/or plan would have seen a lower imatinib price (given that the aggregate non-Quallent price experience for that product was lower than the observed Quallent price; no one was higher than Quallent per Figure 6).
Of course, Medicare represents just one way to view the drug pricing world. Others exist that we can also use to try to unravel the mysteries of Quallent’s drug pricing.
Medicaid
Many tell us Medicare is the end-all-be-all program for drug pricing analysis; however, we cannot help but to assess the Quallent experience in Medicaid as well. After all, 46brooklyn largely got its start studying Medicaid data (you might say it’s in our DNA). How could we not look under the hood?
What’s wild is we don’t get the same answer or experience if we attempt to replicate this Medicare analysis in Medicaid.
To start, growth of Quallent Pharmaceuticals sales has not been as impressive dollar-wise in Medicaid as it has been in Medicare (though on a percentage basis, it is perhaps more impressive). Per CMS State Drug Utilization Data (SDUD), in 2022, there were just $38K in total gross expenditures on Quallent products in Medicaid programs across the nation, and by 2024, there were $2.5 million in total gross expenditures (which while a 6,000+% rate of growth, is less than 2% of the expenditures on Quallent in Medicare in 2023 [as stated earlier, $129 million was spent on Quallent in Medicare in 2023]). On a prescription basis, there were just 1,988 Quallent-sourced prescriptions filled in Medicaid in 2022, which has grown to 16,251 prescriptions in 2024 (713% growth, but less than 1% of the number of prescriptions for Quallent products in Medicare in 2023 [again, 5 million+ prescriptions of Quallent products were filled in Medicare in 2023]).
As previously identified, although Quallent offers 50+ products according to their website, the SDUD suggests that only 41 products were utilized in Medicaid in 2024. The total expenditures on these 41 products across all labelers was a gross $1.5 billion in Medicaid throughout 2024. On a per unit basis, just eight of the 41 products Quallent offers had a higher unit price than all other labelers for the product in Medicaid in 2024. Conversely, 33 had lower prices. Performing the same type of premium analysis as we did in Medicare (see lead up to Figure 8) yields significantly different results with the Medicaid data (Figure 9).

Figure 9
Source: CMS State Medicaid Drug Utilization, 2024
As shown in Figure 9, if Medicaid’s prices for all the drugs that were available through Quallent in 2024 were to effectively be changed to Quallent’s prevailing prices at the same time, Medicaid’s expenditures would decline around $245 million, or 16% less than what Medicaid spent on these therapies across all suppliers in 2024. While there are some products that overlap between the list with similar experience (i.e., both gabapentin and quetiapine appear to be net premium products), others differ significantly (such as the age-old favorite imatinib being a cost-increaser in Medicare but a cost-saver in Medicaid).
Of course, the aggregate experience can conceal some of the detailed realities. If we break the Medicaid experience out by state, some of the drugs that are Quallent cost-savers in the national aggregate can be more costly depending upon where you live. Let’s take a look at lisinopril, the biggest Quallent-sourced Medicaid cost-saver in Figure 9. Quallent NDCs for lisinopril were dispensed in just five states: Illinois, Michigan, Minnesota, New Mexico and Texas. While Quallent products resulted in savings in the aggregate and for the majority of these states, it was a significant premium when used in Michigan and a small premium when used in Texas (Figure 10).

Figure 10
Source: CMS State Medicaid Drug Utilization, 2024, Lisinopril
And before you ask, we’re not sure how some states got better Quallent pricing than others. As you can see, average non-Quallent Medicaid prices in these states for lisinopril ranged from $0.09 per pill to $0.89 per pill, while average Quallent lisinopril prices in these states ranged from $0.11 per pill to $0.23 per pill. While we're presenting the information above in a manner similar to what Medicare does to try to be consistent, Medicaid does give us the ability to break out these rolled up products into individual strengths and dosage forms. However, even taking advantage of the additional detailed data (Figure 11) in Medicaid, we directionally see the same thing Figure 10 is showing (Figure 11 reproduces the results of Figure 10, but puts each lisinopril product line under each state).

Figure 11
Source: CMS State Medicaid Drug Utilization, 2024, Lisinopril
Looking at Figure 11 compared to Figure 10, we reach no different conclusions from those we already drew. However, Figure 11 does highlight the important role that our access to data, and the details therein, can potentially have in influencing our perceptions of drug pricing reality. Whether we roll up products or go down to specific strengths or dosage forms, we do not appear to be any closer to understanding the variability in prices we’re observing. While variance for Medicaid programs broadly can be reasonably attributed to a multitude of factors like different mixes of pharmacies and manufacturers, it becomes a tad perplexing when the same company owns the manufacturer/labeler, the pharmacy, and the PBM negotiating the payment. Conventional wisdom would suggest that pricing would be aligned from state to state if the massive healthcare vertical that is manufacturer-to-plan-to-PBM-to-pharmacy and thus have maximum control over the price-setting of the product. Yet, even with the aggregate cost savings produced from Quallent’s lisinopril, it seems strange that the same drug over the same time period from the same company could be more than twice as expensive from one state to another. Or looking back at imatinib, how can the yielded Quallent unit price in Medicare be 2.5x higher than the average of all other labelers of the product, but in Medicaid, all other labelers of imatinib are 4.5x higher than Quallent?
To underscore this point, whether we attribute the yielded pricing realities to the drug company, the pharmacy, the PBM, or some combination of each, with vertical integration, the experience is all rolled up to the same parent company. So how can the prices yielded by the parent company be so disparate from state to state or program to program?
We’re honestly not sure. So we did what we always do and grabbed yet more data.
Commercial
For our last review, we ventured into the only other major market segment left: the commercial marketplace, which provides coverage to around half of all Americans. This time we grabbed the National Average Drug Acquisition Cost (NADAC) Reports from Evernorth (another component of the broader Cigna/Express Scripts parent company). These required public disclosures under a West Virginia law require PBMs to self-report instances where their drug pricing exceeds 10% (plus or minus) of the underlying NADAC costs for commercial plan sponsors. These reports offer a great deal of pricing transparency directly from the PBM’s themselves (which we view as an absolute positive). Files on Evernorth’s website range from Q1 2022 to Q1 2025 as of this writing. And while it would be great if we could roll forward the clock on these observations to Q1 2025, when we grabbed that file, we did not see any Quallent products. To be clear, no Quallent products hitting the +/- 10% of NADAC pricing is a finding in and of itself; however, that finding does not allow us to really study the Quallent question. So to do that, we elected to select the 2023 files, as it would align with our Medicare data (the rate limiting step of observations is Medicare doesn’t yet have 2024 data like Medicaid, plus Medicare pricing is often a closer approximation to Commercial claims than Medicaid). So, for this reason, we gathered all four quarters of 2023 files and merged them together.
We started as we did with the others: seeking to identify the number of Quallent products used in these West Virginia commercial plan sponsors and whether there was a premium or savings to be had with the Quallent product relative to everyone else. To start, we find that 38 Quallent products were used by West Virginia commercial plan sponsors in 2023 per Evernorth/Cigna/ESI’s data. Of these, 12 had a premium relative to non-Quallent NDCs, and the remaining 26 were lower cost. All told, the total value in the net (Quallent-yielded prices minus Non-Quallent-yielded prices, multiplied by total units dispensed) was such that commercial plan sponsors saw aggregate net savings with Quallent products ($691K in savings; Figure 12). Relative to $14.99 million in observed drug cost expenditures for these products in 2023, this savings represents approximately 4.6% relative to the current spending on these products.

Figure 12
Source: Evernorth NADAC Reports, WV, 2023
So, as a starting point, commercial data appears to agree with Medicaid data in terms of overall direction of Quallent-sourced drug prices (but generally disagrees with Medicare). We can draw several additional details from the West Virginia data though.
First, we can confirm that Quallent products appear to be exclusively sold at Express Scripts-affiliated pharmacies, as across over 34,000 claims in the commercial database for Quallent products, all but one were dispensed by a pharmacy named either Express Scripts or Accredo.
Second, we can see on an individual basis how Quallent might play into the strategy of Express Scripts more broadly. In looking at the drug omeprazole for example, where the net experience of comparing Quallent-sourced prices versus non-Quallent-sourced prices shows savings for commercial payers, when we zoom in, we can see that nearly all of the top-end prescriptions are being filled with Quallent NDCs. In Figure 13, we analyze all omeprazole prescriptions in the 2023 WV Commercial ESI NADAC reports where the payment was 20-fold or more higher than NADAC (the basis for WV commercial reporting is +/- 10% of NADAC, so we’re looking for activity that is in an absolute extreme category relative to the reporting threshold). We select this threshold because it is where we first observe Quallent prescriptions (from a highest to lowest NADAC mark-up basis). What we find is that, of the 203 claims in the database where commercial plan sponsor prices for omeprazole were more than 20 times higher than the underlying average pharmacy acquisition cost for the drug (NADAC), 104 of them (51%) were Quallent NDCs. And of these, all were dispensed at Express Scripts pharmacy.

Figure 13
Source: Evernorth NADAC Reports, WV, 2023
And while Figure 13 does identify that West Virginia-situated pharmacies like Walgreens or Miller Brothers got higher unit prices on omeprazole in 2023, they only got one (Walgreens) to three (Miller Brothers) prescription filled at those inflated omeprazole reimbursement prices ($4 per unit of omeprazole). And to be clear, Walgreens and Miller Brothers Pharmacy are likely only getting these omeprazole prices because they’ve submitted high Usual & Customary (U&C) prices asking to be paid lots of money for omeprazole prescriptions (for those unfamiliar, think of pharmacy U&Cs as the pharmacy’s sticker or ceiling price, which are routinely over-inflated relative to the pharmacy’s actual acquisition costs). But that brings us to a broader point, when reimbursement is a lottery as opposed to something more resembling one clear, market-clearing price, what incentives do we realistically expect pharmacy providers to follow? Ask most pharmacies and we think you’ll find they’d rather get paid $0.76 per pill on 104 omeprazole prescriptions as opposed to $4.91 per pill on one or even three omeprazole prescriptions, but if you can only get three high-margin fills at $0.70 or more per unit, then we’re willing to bet that you — if you were a pharmacy provider — would seek to maximize the profits you can get (especially when considering the frequent losses that pharmacies shoulder).
If Figure 13 doesn’t do it for you, maybe this last one will.
Taking what we’ve learned thus far, what price for imatinib from Quallent at Express Scripts pharmacies should we expect in 2023? Is it $103 per pill as Figure 6’s Medicare experience tells us, the $182 per pill as Figure 12’s commercial experience tells us? Or perhaps it is $2.50 as it was for Medicaid in 2024 (Figure 9; we looked and there was no Quallent imatinib utilization in Medicaid in 2023 to align the years on). Figure 14 puts these experiences together for your viewing pleasure.

If you’re looking at these prices like we are, you start to question how this can be. When the same highly-leveraged company essentially has maximum control over the distribution of a product from drug company to PBM to pharmacy — or more plainly, from price creator to price negotiator to price receiver — how in the world can this range be so pronounced?
And even putting the Medicaid price aside, since the 2024 year doesn’t align with Medicare and Commercial, there is a $79 per pill difference between the Medicare and Commercial experience in 2023. Said differently, and to West Virginia employers, would you like to pay a 77% premium relative to Medicare’s price for imatinib?
We honestly don’t know what price Quallent and/or Express Scripts wants us to expect, because even these averages conceal individual results, which vary widely. It certainly seems that the data is informing us that we’ve unearthed some sort of hybrid pricing schedule for Express Scripts clients related to Quallent pricing (akin to mixing some frog DNA with our dino-DNA). This is because individual, state-specific imatinib prices are different than the $2.50 Medicaid aggregate shown in Figure 9 (as also demonstrated for lisinopril pricing in Figures 10 and 11), and there are commercial West Virginia claims that pay above and below the $182.20 per pill average shown in Figure 12.
Perhaps rather than trying to speculate on why things are the way we observe them, we would be better to speculate on what the impact of these observations may be in our drug pricing theme park. We can see a world where, in response to state legislative actions like those of anti-steering to specific mail or specialty pharmacies (see our Accredo/Dell example earlier in this report), the industry moves in a direction that says you can get your imatinib or capecitabine or whatever product you want filled at the pharmacy of your choosing, but the only catch is that the PBM can impose is a labeler restriction that says the dispensed product must be Quallent (i.e., Labeler code 82009). Again, we know labeler code restrictions already exist (see our Medicaid example earlier). The only difference with this new approach is that when the labeler restriction is applied, it might also carry with it the net effect that the PBM-affiliated pharmacy is the only one who can supply the product (only one theme park you can visit to see dinosaurs).
And as the data suggests, this form of steering can yield a wide range of potential impacts to the pharmacy market — some of which can leave non-PBM-affiliated pharmacies filling a disproportionately high number of claims that are less profitable than others and others that can provide a disproportionately high number of highly profitable claims to PBM-affiliated pharmacies. Similarly, this form of steering can yield a wide range of potential impacts to the plans to the end payer — some of which can decrease costs and others that can increase them.
“Life, uh, finds a way.”
Look, we get it, drug pricing is complicated, and we just ran through a lot of numbers really quickly. This started as an educational exercise in how PBMs’ private label product strategy may help them skirt anti-steering laws, and we ended up using data to demonstrate that PBMs’ role as drug manufacturer might see them adopt the very strategies they claim to advocate against (i.e. inflating drug prices). From an outsider’s perspective, we can see how this can seem to be an anti-PBM story, though we honestly do not intend it as such (it’s all the plan sponsor’s fault, right guys?). Rather, we believe that if you claim to be the only entity working to lower prices – as PBMs do – then you are self-selecting a higher level of scrutiny of your practices relative to other supply chain members.
We acknowledged that we should not be surprised by our findings, as these for-profit companies undoubtedly want to make more money just like every other member of the drug channel, but we guess that the collective hope is that PBMs would find a way to make more money in a manner that is not tied to the price of the medications they’re charged with managing (that in some sort of utopia, they might make more money by making us healthier rather than raising our drug premiums because we’re sicker than they thought we’d be or burying their compensation underneath the inflated prices of medicines).
If PBMs truly view themselves as cost-containment specialists – the only ones doing so, per their PR – Quallent’s imatinib pricing is hard to reconcile with that mission. As a collective body, Express Scripts – who undoubtedly knows more about drug pricing than these humble researchers and consultants – appears to be having trouble finding a way to lower imatinib’s costs, but relative upstart Mark Cuban and other cash-pay pharmacies can. Part of the reason we’ve been so fascinated with the cost-plus movement (besides its efforts to better align provider incentives) is that the origin of 46brooklyn’s DNA was forged by crazy imatinib prices, and somehow, after seven years of writing about it, legacy PBMs have largely failed where much smaller cost-plus pharmacies like Cuban have succeeded.

Is it a system failure? Is it being done on purpose? Is it all the fault of plan sponsors? Or are these a series of unfortunate accidents that somehow push billions of dollars into the pockets for-profit "cost-savers?”
It strikes us a less than rocket science, but perhaps more than dino-DNA extracting, that if your role is to lower drug prices, then when you control the price (because it is dispensed at your affiliated pharmacy or under your owned private label or under your PBM or under your health plan or some combination of any and all of these), you would have enough information and control to guarantee that your price is the lowest – the lowest to the patient, the lowest to the plan, the lowest to the government, the lowest across the board. Except, that is rarely what we see.
Rather, we see a mix, where sometimes they’re lower (sometimes by a lot) and sometimes they’re higher (also, sometimes by a lot). And in the grand mix of drug products dispensed, the PBM seems to have a magical coin that ensures that on flips that land heads, they win; and on flips that land tails, others lose. Or to paraphrase Jurassic Park, the PBMs were so preoccupied with whether they could set drug prices, they didn’t stop to think about whether they should.
Regardless, here we are, still shouting from the watch-towers that drugs like imatinib are still suffering from disparate pricing and frequent bloated mark-ups. Seven years have passed, and Congress is still on cusp of passing something that won’t solve it, the FTC is still investigating something we’ve already known is happening plain as day, and plan sponsors are still signing contracts that sanction the conflicted price-setting and network-creation that provides the real estate for it all to continue. Yet, the chest-beating over high drug prices persists, as if the details underneath the headlines aren’t part of the very structure that props them up in the first place.
Do we even want to solve these problems, or is the kayfabe of forever-attacking a non-specific evil blob of high prices all we really want? Just remember, whatever happens, that’s the plan.