
New drug pricing analysis reveals where PBMs and pharmacies make their money
For those uninitiated, 46brooklyn Research was founded by two Ohio pharmacy guys who had seen enough problems in the prescription drug supply chain to know that transparency and accountability were sorely needed.
Prior to our launch in August 2018, we spent months digging into publicly-available data to expose a growing gap between the actual price of generic drugs and the rates being essentially billed back to state Medicaid programs. Because of our experience in pharmacy, we knew that those markups were not making their way to Ohio pharmacies, so we set out to uncover and expose where all that money was going.
After two years of significant erosion of pharmacy margins within the Medicaid managed care program, in January 2018, the Ohio Joint Medicaid Oversight Committee’s actuarial firm, Optumas, reported that prescription drug spending had increased nearly 20% over a two-year stretch in the Ohio Medicaid managed care program. Because of what we knew about what was happening in pharmacy, and because we knew that generic drug prices were tanking, it didn’t make sense that state costs could be increasing so much. Later, Ohio state Representative Mark Romanchuk demanded to see a breakdown of the spend, where we learned that despite the lower payouts to pharmacies and the deflating generic market, Ohio’s generic drug unit costs increased 1.8% in SFY 2017 (Figure 1).
Figure 1
Source: Ohio Joint Medicaid Oversight Committee (JMOC)
That’s when the Columbus Dispatch began their award-winning investigative Side Effects series that dug into state Medicaid drug spending and things started unraveling. Lawmakers called on the state Auditor Dave Yost to audit the books, and the initially-reluctant Department of Medicaid launched their own inquiry as well. The legislative finger-pointing commenced.
“If you knew how much a yard of concrete costs, you know how many yards are in a mile and you can estimate how much you should spend on concrete ... When the person who is doing that work isn’t telling you how much they paid for the concrete — they just tell you how much it costs for a mile of road — that gets to be a very expensive highway.”
Buried drug pricing treasure found
In the midst of all the chaos, 46brooklyn’s co-founders stumbled upon the CMS State Utilization Data files that shockingly showed what states like Ohio were getting charged for retail pharmacy prescriptions. We then stitched that data together with CMS National Average Drug Acquisition Cost (NADAC), which provided a good approximation for pharmacy invoice costs paid to wholesalers to acquire their medications. While NADAC is missing drugs and does not include pharmacy wholesaler rebates, it at the very least is a true market-driven pricing benchmark for generic drugs. In other words, unlike Average Wholesale Price (AWP) or Wholesale Acquisition Cost (WAC), it actually follows the laws of supply and demand we all learned in Econ 101.
Anyway, when we joined State Utilization and NADAC data, we noticed that the trend in reported managed care unit costs and NADAC were diverging for a whole lot of generic drugs in a whole lot of states. We proceeded to run around Columbus, New York, and Washington DC, sharing infantile versions of our Medicaid Drug Pricing Heat Map with lawmakers, Medicaid officials, and media to show the massive pricing distortions occurring within state Medicaid managed care programs.
Eventually, we realized that running around the country with a laptop was not the most efficient manner to disseminate this information, so we decided to begin building 46brooklyn to make our work public. In the meantime, the Columbus Dispatch traveled the state of Ohio picking up data files from pharmacies to see what they were actually being paid in Ohio’s Medicaid managed care program. They compared that data to what the state was being charged, and released a blockbuster spread pricing analysis on June 17, 2018.

Photos by Joshua A. Bickel, Columbus Dispatch
Sunlight beams in Ohio
The Columbus Dispatch’s work to expose “spread pricing” set off a huge chain of events. After months of administration officials downplaying the significance of the pricing gaps, within just a week of the Dispatch’s spread story, the Department of Medicaid released a summary of their spread pricing analysis, which showed PBMs grabbing $223.7 million in hidden pricing spreads within the Medicaid managed care program from Q2 2017 to Q1 2018, accounting for 8.8% of overall (pre-rebate) spending on prescription drugs.
While the analysis showed PBMs taking three to six times the going rate for PBM services, there was still significant skepticism that the Department was being as forthcoming with information as the legislature expected. In that vein, Ohio state Senator Bill Coley surprised administration officials during the June 28, 2018, meeting of the Joint Medicaid Oversight Committee, where he turned the tables on the Department and presented a “(more) Complete PBM Picture,” which highlighted the lack of rebate and specialty pharmacy data, among other analysis shortfalls. The committee hearing officially popped the balloon of those who may have tried to paint the findings as anything in the realm of reasonable.
While the ongoing drug pricing saga in Ohio is far from over, here’s a few highlights of what went down after July 1, 2018:
Ohio administration officials questioned over ties to CVS/Caremark
CVS/Caremark sues to keep full Medicaid PBM analysis hidden from public
Ohio Attorney General Mike DeWine announces plans to sue PBMs
Days later, the state finally admits that they were overcharged
Ohio Medicaid officials terminate all PBM contracts and demand transparency
In August, Ohio state Auditor Dave Yost released his PBM audit that validated the findings in the Ohio Medicaid analysis, but the audit was even more thorough and revealed how spread pricing was predominantly a generic drug phenomenon – showing that of the total state spending on generic drugs, 31.4% went to PBMs via spread pricing (Figure 3).
Eventually in September 2018, the Department of Medicaid was finally able to release a more complete (yet heavily redacted) version of the state’s commissioned PBM analysis that was chock full of drug pricing data and goodies, including that while PBMs were making three-to-six times their going rate, Ohio pharmacies were underpaid by around $9 per prescription relative to typical market rates.
Ohio’s Q3 2018 data now shows what pharmacies are being paid
Part of the reason we gave you the extended timeline of events above is that:
Ohio’s previous state Auditor Dave Yost is now the state Attorney General, and Ohio’s previous state Attorney General Mike DeWine is now Governor. Both have hinted that PBM scrutiny will continue, and that on the legal front, “there’s a storm a-comin’.”
Earlier this month, U.S. Senators Chuck Grassley (R-IA) and Ron Wyden (D-OR) heavily relied on the Ohio revelations when they officially called on the Inspector General of the U.S. Department of Health and Human Services to “conduct a federal-level analysis of PBM practices across state Medicaid programs, including practices that may allow for inappropriate profiteering and potential anti-competitive practices in state Medicaid programs.”
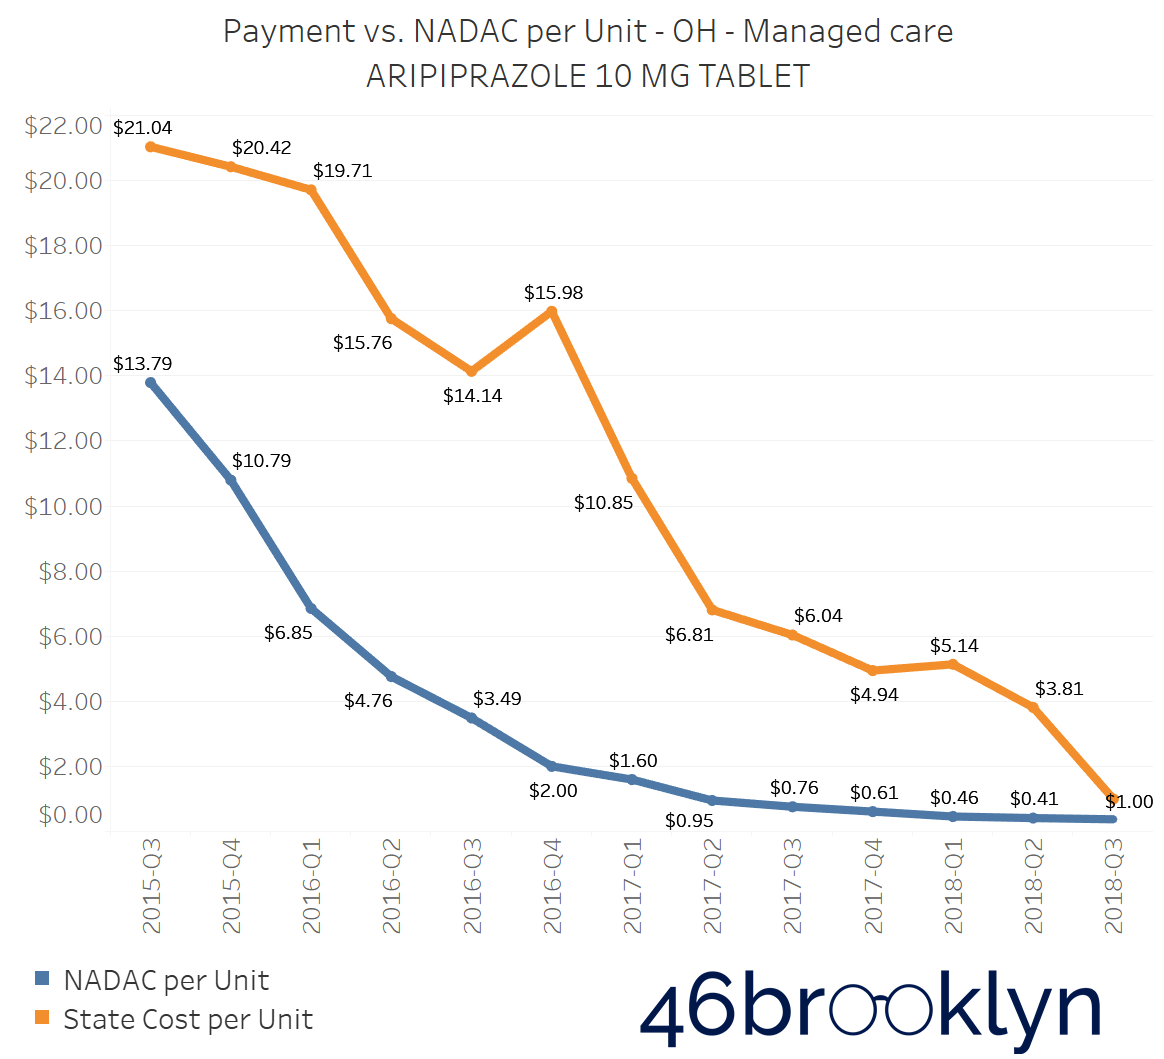
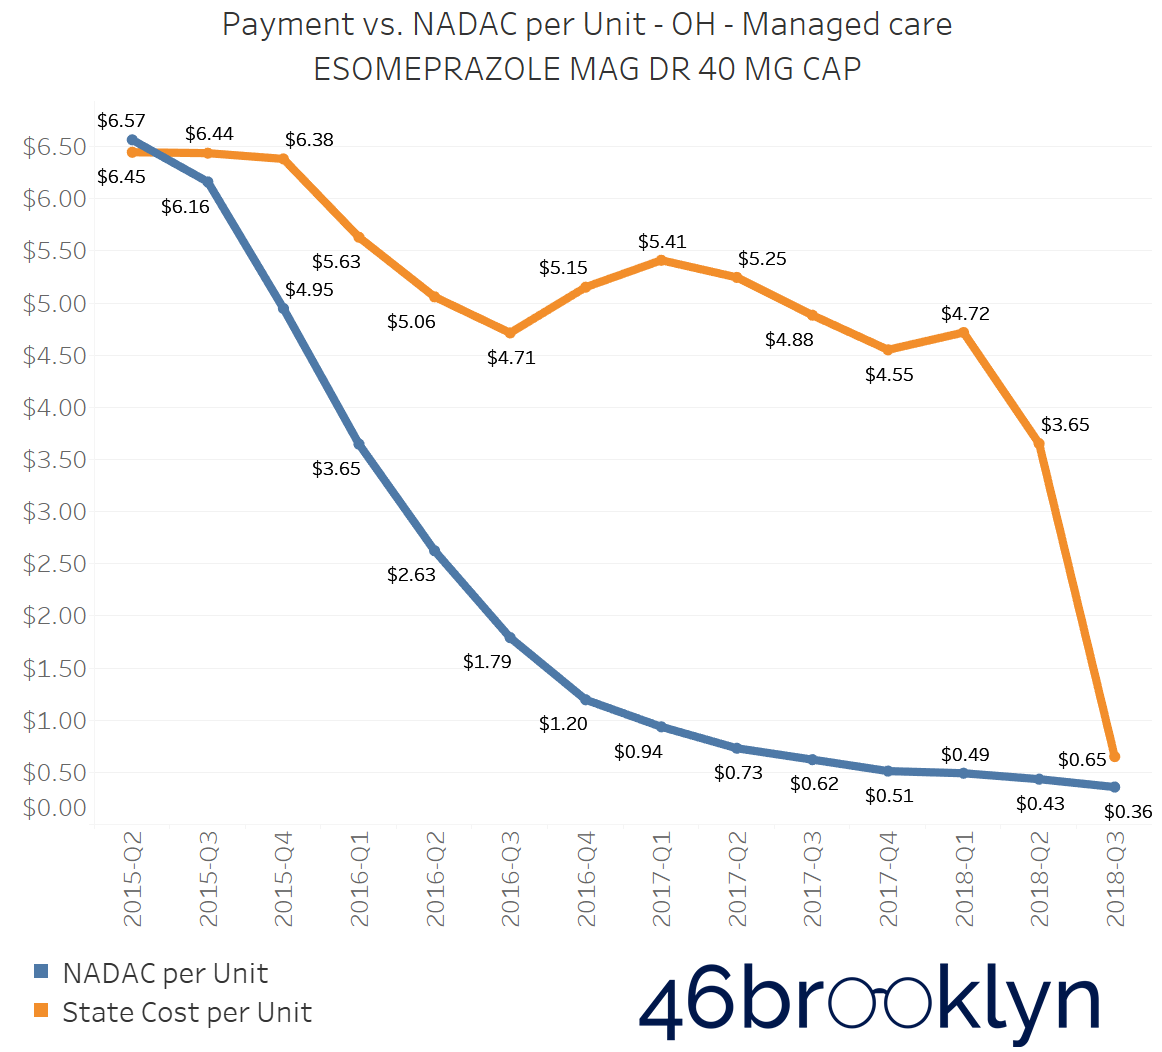
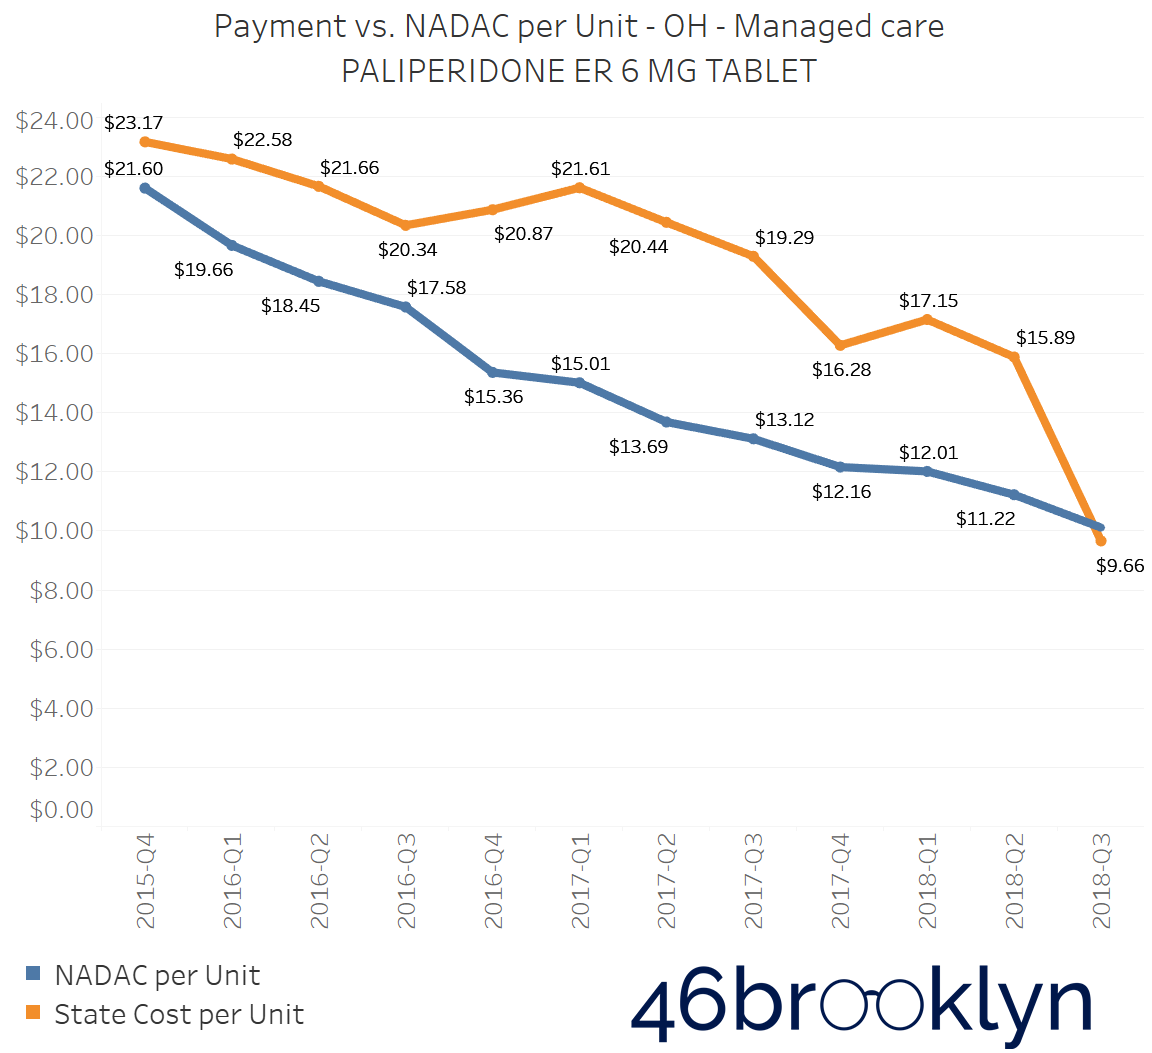
With all of this as backdrop, sometime around a month ago, CMS posted Q3 2018 State Utilization Data. We did a little jig, downloaded the data, and immediately stitched the new data into all of our dashboards. With Ohio being our home state, we have this bad habit of flipping through several of the notorious high-markup drugs in Ohio Medicaid managed care to see the continued divergence in state costs vs. acquisition cost. It’s the common cast of characters that are mispriced in practically all states that have a heavy managed care presence (not a coincidence), for example:
generic Ziagen (abacavir)
generic Abilify (aripiprazole)
generic Nexium (esomeprazole magnesium)
generic Invega (paliperidone)
generic Crestor (rosuvastatin calcium)
generic Prograf (tacrolimus)
So we started flipping through the Q3 2018 charts for these drugs, and our jaws hit the floor. As you will see in the chart gallery below, on every one, reported managed care unit costs all dropped precipitously to numbers that were actually not far from acquisition cost. Every one. Use the arrows to flip from one drug to the next.
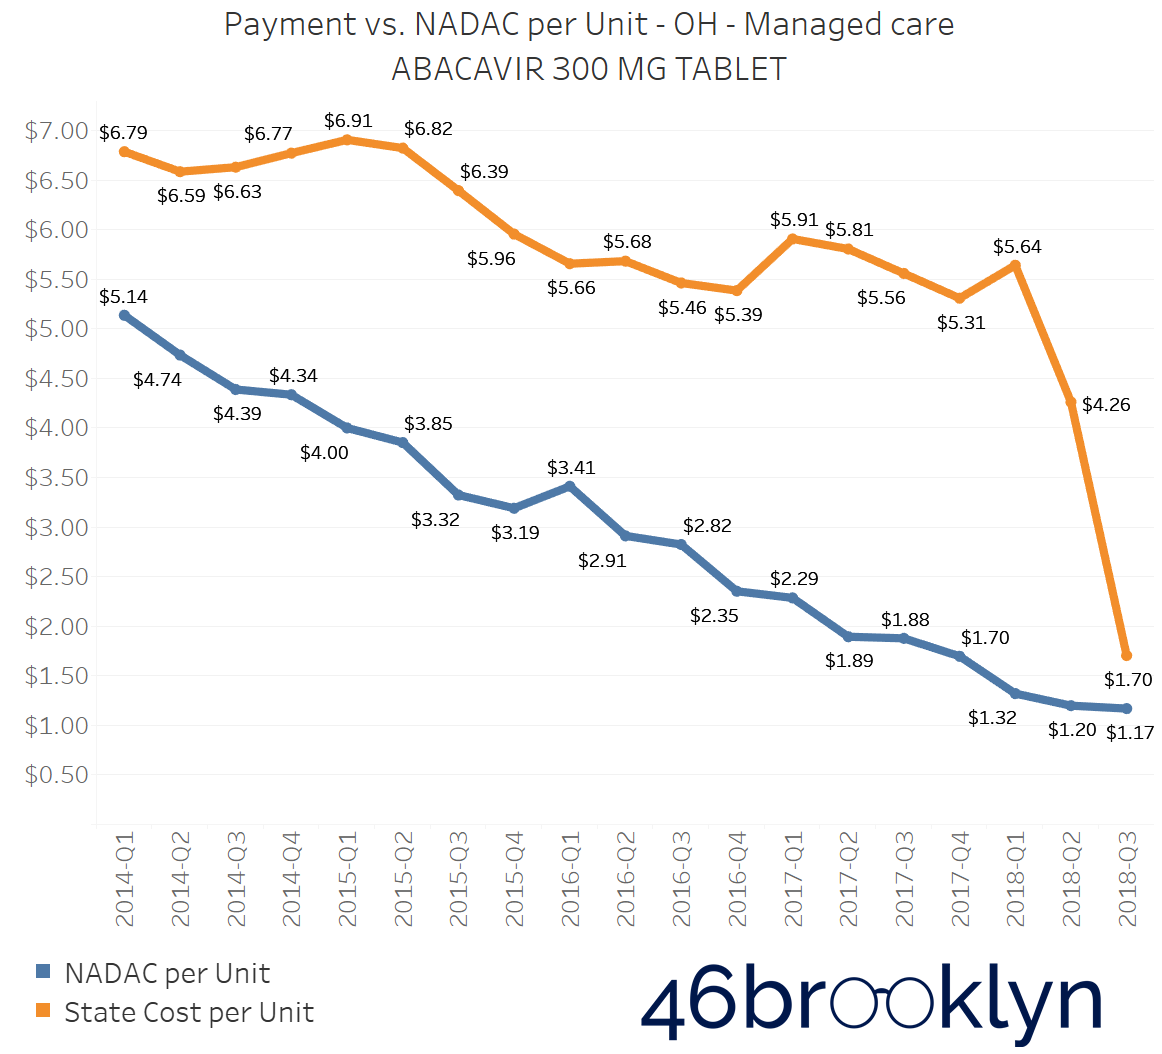
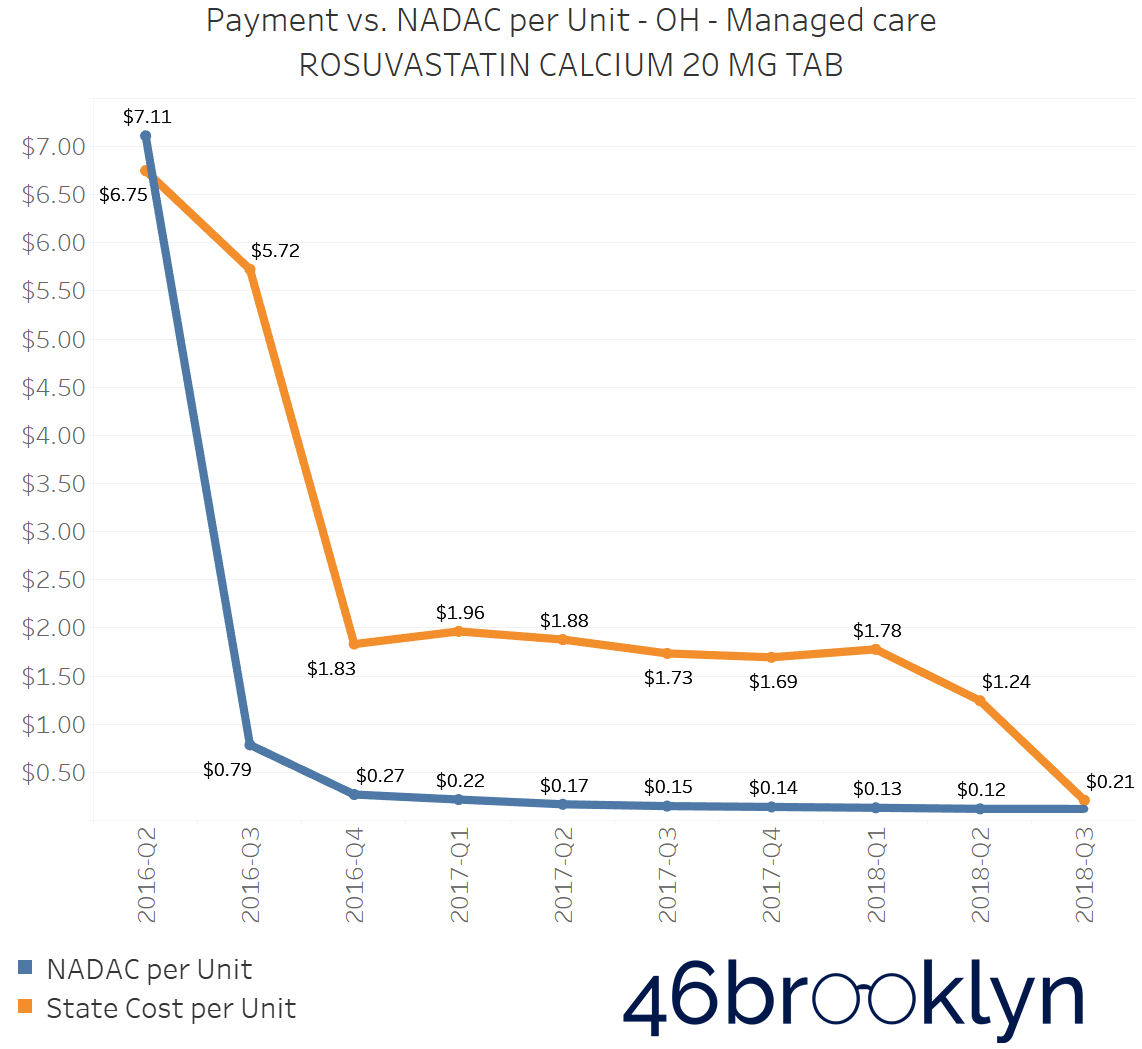
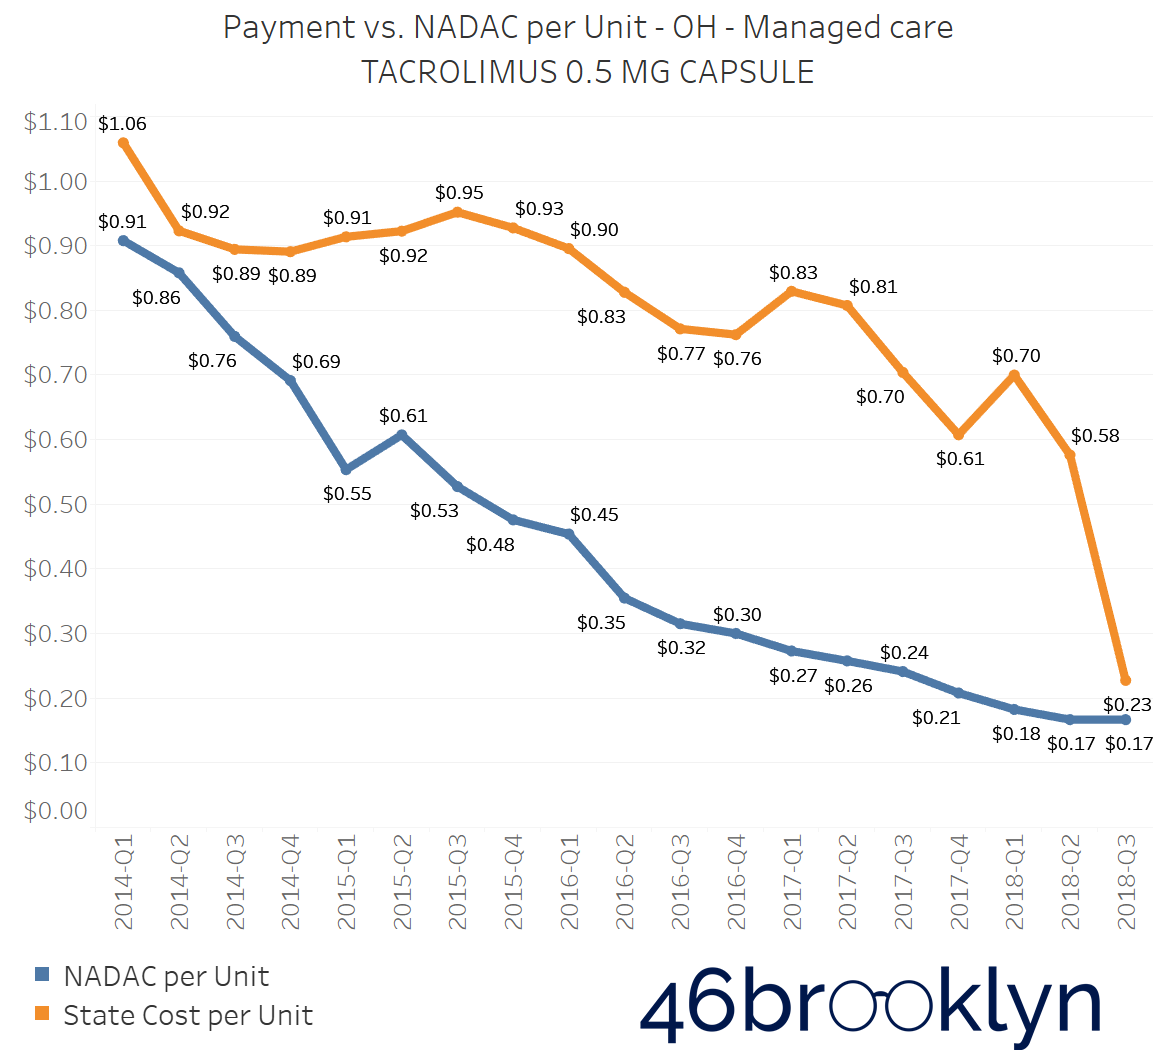
Overall, Ohio’s weighted average unit cost for oral solid generic drugs fell from $0.41 to just $0.28 – a staggering 31.7% drop (Figure 4). How about that for an amazing coincidence?! Recall that Auditor Yost found 31.4% spread pricing on generic drugs.

Figure 4
Source: CMS.Data.gov; 46brooklyn Research
Our initial reaction was to brush this off as a result of incomplete reporting of Q3 2018 data by Ohio. However, even with incomplete data, the odds that each one of these common spread drugs each fell in line with NADAC just seemed too remote to be coincidence. In addition, as shown below, the $0.13 sequential drop in managed care generic drug unit costs reported by Ohio was dramatically out of line with all other states (Figure 5).
Figure 5
Source: CMS.Data.gov; 46brooklyn Research
All told, we simply couldn’t resist doing some more digging…
It turns out that as the month of June came to a close, new transparency requirements took effect in Ohio on July 1, 2018, (coincidentally, right at the start of Q3 2018) that prohibited state Medicaid managed care plans from cooking PBM spread into the Utilization Data reported to the Department of Medicaid. This meant that the State Utilization Data from Q3 2018 was perfectly timed with the state of Ohio beginning to collect data that removed PBM spread from the data.
In other words, it just so happens that for Q3 2018, our Medicaid Drug Pricing Heat Map, Medicaid Markup Universe, Medicaid Markup Galaxies, and Top 20 Over $20, all show only what pharmacies were paid for generic drugs in Ohio, whereas for all prior quarters, they show what pharmacies and PBMs were collectively paid for these same generic drugs. This lucky timing now gives us an unprecedented ability to see which drugs were targeted by PBMs for spread pricing – all we have to do is study changes in managed care unit costs from Q2 to Q3 2018 in Ohio. It’s not perfect folks, but this is (to our knowledge) the first drug-level look at spread using exclusively public data. Without further delay, let’s dive in and see what we can find.
Ohio Medicaid managed care Markup Galaxies
The best way (in our view) to visualize what’s happened in Ohio is through our Medicaid Markup Galaxies dashboard. For a full overview of how to use this dashboard, complete with a few case studies, check out this report. But the general idea of the tool is to group national drug codes (NDCs) dispensed within any given state Medicaid program into three buckets: High Cost, In-Range, and Low Cost. We’ve defined High Cost as those NDCs that carry a markup of $15/prescription or greater, Low Cost as those NDCs that sport a markup of $5/prescription or less, and In-Range as everything in between. Feel free to poke around in the embedded version below, or head over to our visualizations page to interact with it in a slightly larger format.
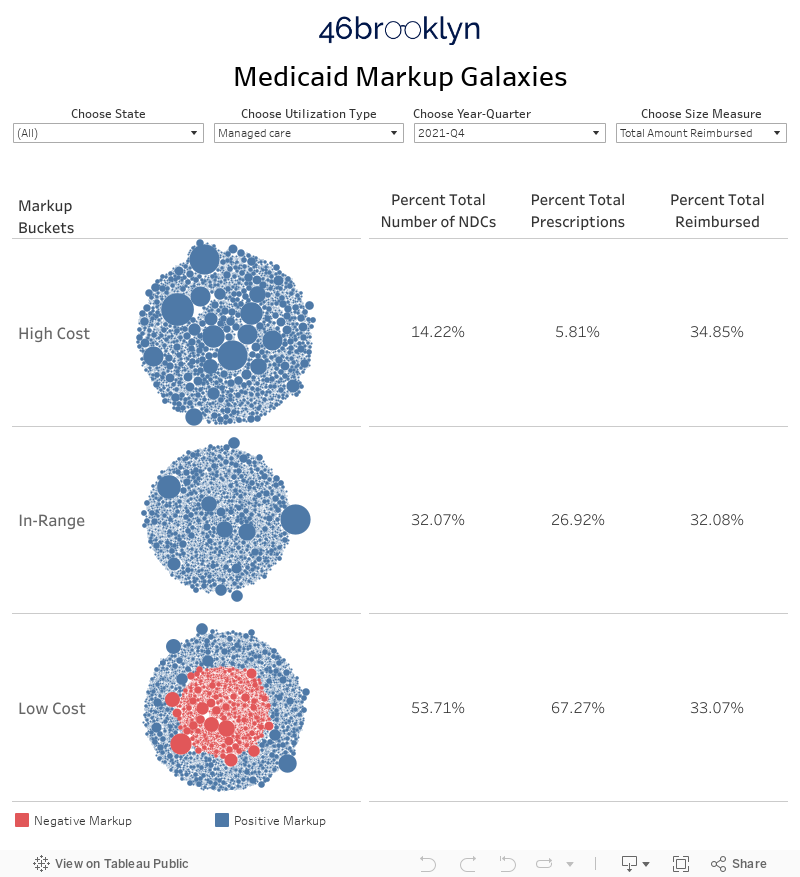
Hopefully you took a minute to select "OH” above, and flip between Q2 2018 and Q3 2018 to see what’s changed in Ohio Medicaid managed care. You can also hover over any bubble to bring up information on that NDC. But no worries if you didn’t – we’ve put them side by side for you in Figure 6 below.
Figure 6
Source: Data.Medicaid.gov, 46brooklyn Research
A few takeaways pop from this visual:
There appear to be a lot fewer NDCs in the High Cost bucket in Q3 2018. Putting some stats to this observation: 17.0% of all NDCs were High Cost in Q2 2018, only 4.6% of NDCs were High Cost in Q3 2018.
There appear to be a lot more NDCs in the Low Cost bucket in Q3 2018. More stats: 65.6% of all NDCs were Low Cost in Q2 2018, while 87.8% of NDCs were Low Cost in Q3 2018.
There appear to be a lot more red bubbles (i.e. NDCs that were priced below NADAC) in Q3 2018. Even more stats: In Q2 2018 8.6% of NDCs were priced below NADAC, in Q3 2018 42.7% of NDCs were priced below NADAC. Ouch! … if you own a pharmacy
It’s very important to remember that nothing actually changed in Ohio from Q2 2018 to Q3 2018. There were no immediate changes to managed care or PBM contracts, besides the new transparency requirements. Capitated rates paid to managed care organizations didn’t plummet on July 1, 2018. The state didn’t save any money. None of that. Instead, the discrepancy we are seeing is simply the fallout of a significant change in how the data was reported. In Q2 2018, we saw the data from the state’s perspective. In Q3 2018, we are seeing the data from the pharmacy’s perspective. The difference is just another way of looking at spread pricing.
Actually, come to think of it, it’s probably easier to at least conceptually think of Figure 6 in the manner presented in Figure 7. We are immensely grateful to Senator Ron Wyden for his excellent deadpan joke about spread pricing in this month’s PBM hearing (where he compared it to cream cheese) as we now have a new logo for spread pricing that we will most certainly “spread” liberally across our future writing.
Figure 7
Source: Data.Medicaid.gov, 46brooklyn Research
The Spread Drugs PBMs Use to Butter their Bread
Now it’s time to get in the weeds and look at individual generic drugs to identify those that experienced the largest sequential declines in managed care unit cost. Again, given that nothing fundamentally changed from Q2 to Q3 in Ohio, this analysis should provide us with a helpful list of some of the more abused spread drugs.
Figure 8 shows the generic oral solid drugs that saw the largest sequential decline in reported managed care unit cost in Ohio from Q2 to Q3. Please note that we only focused on drugs on which the state reported spending more than $100,000 in Q2 2018 to concentrate the list on the generic drugs that are likely more responsible for spread.
Figure 8
Source: Data.Medicaid.gov, 46brooklyn Research
Overall, we calculate that the total gap in reported pricing seen on the drugs listed in Figure 8 is worth $11 million in one quarter (based on Q2 2018 Ohio managed care utilization). In other words, spread pricing in Ohio Medicaid managed care on these drugs alone could annualize to $44 million.
Our loyal readers should see some familiar drug names in the above list: Rosuvastatin, Esomeprazole, Aripiprazole, and Hydroxychloroquine. It’s fascinating (and not overly surprising) to see that many of drugs that we had previously identified as “high markup” seem to be “high spread” drugs under this analysis.
But not all those markups were because of PBM spread…
Generic Gleevec is back again!
Interestingly, there were a handful of high-markup generic drugs in Ohio Medicaid managed care that did not show a meaningful decline from Q2 2018 to Q3 2018. In other words, when Ohio changed reporting requirements from what managed care plans paid to what pharmacies received, the unit cost reported to the state for these drugs didn’t change much. This can only mean that these are drugs that Ohio’s PBMs have for some reason decided to “overpay” pharmacies to dispense.
The easiest way to visualize these drugs is to use our Medicaid Markup Universe dashboard. Just select “OH,” “Managed Care,” and “Q3 2018,” and this is the chart you will see. That tumor to the left of the universe is – you guessed it (if you read our work regularly) – Imatinib Mesylate, or generic Gleevec.

Figure 9
Source: Data.Medicaid.gov, 46brooklyn Research
No matter how hard we try, we simply can’t avoid bumping into Imatinib Mesylate when we are analyzing generic drug pricing distortions. It is without a doubt the poster-child for how egregious pricing distortions can get in a system where the PBM – by offering payers immensely complicated contracts that are beyond comprehension – have created a cash grab for the supply chain as actual generic drug costs deflate.
Thanks to Ohio’s change in reporting requirements, we now are quite certain that the Imatinib Mesylate treasure chest is being passed on to pharmacies. So the logical question is, which pharmacies?
While there is no public data available to precisely answer this question, there are enough clues to get close enough.
We dug through publicly-available preferred drug lists (PDLs) for Ohio’s five Medicaid managed care organizations (MCOs) – Buckeye, Molina, Paramount, CareSource, and UnitedHealthcare. The first four of these MCOs all used CVS/Caremark to manage their prescription benefit in 2018, while United uses (and owns) OptumRx. Buckeye actually uses two PBMs – CVS/Caremark and Envolve – a finding that was brought to light in HealthPlan Data Solution’s analysis of spread pricing in Ohio Medicaid managed care and has since been highly criticized by the rightly very baffled Columbus Dispatch, as it appears the state may have paid twice as much for seemingly duplicative services.
While we had heard anecdotes from oncology practices that CVS/Caremark has a track record of strong-arming the cancer drug market, we wanted to get more than anecdotes.
We found that all plans required a prior authorization for Imatinib Mesylate. This comes as no surprise, because even with its NADAC price of $20 per tablet in Q3 2018, Imatinib Mesylate is an expensive drug, so it makes sense for the PBM to put an extra set of eyeballs on each Imatinib Mesylate prescription before it’s dispensed and charged to the payer.
We dug further – it turns out that in the latest PDLs published by Molina and CareSource (both currently managed by CVS/Caremark), both expressly specify Imatinib Mesylate as a “specialty drug.” Molina’s PDL specifies that all specialty drugs, “must be obtained through a specialty pharmacy.” So that right there likely rules out the possibility that your plain-vanilla retail community pharmacy is grabbing the more than $5,000 in margin per prescription on this drug. But that leads to the next logical question – which specialty pharmacies are getting five large for Imatinib? CareSource’s 2018 PDL provides some clues on that:
Figure 10
Source: CareSource Ohio Medicaid 2018 PDL
So to recap:
PBM sets the price that managed care is charged for generic drugs, including Imatinib Mesylate
Ohio is paying way too much for Imatinib Mesylate – more than $5,000 above NADAC per prescription
Pharmacies appear to be getting this money
Four of five Ohio MCOs contract with CVS/Caremark to manage their prescription benefit
CVS/Caremark appears to be classifying Imatinib Mesylate as a specialty drug
MCOs appear to be directing members to fill specialty drugs at CVS/Caremark
💰💰💰 -> CVS/Caremark
While the above recap certainly calls into question whether CVS/Caremark has adequate incentives to contain costs on this one drug, please don’t conclude that this is just a CVS/Caremark issue.
Most large PBMs have their own specialty pharmacies. As mentioned above, UnitedHealthcare owns their own PBM, OptumRx. OptumRx owns their own specialty pharmacy, BriovaRx. While it is difficult to tell whether patients are directly steered to BriovaRx, they are listed as the Preferred Vendor for Imatinib Mesylate on UnitedHealthcare’s Provider Vendor Assistance List.
As an aside, it appears from UnitedHealthcare’s Ohio PDL, that the definition of specialty drug could essentially be every drug ever made (Figure 11). This ambiguity is kind of important, as PBM contracting Jedi master Linda Cahn pointed out in 2009.
Figure 11
Source: UnitedHealthcare Community Plan 2019 PDL
But this isn’t just a PBM tool. Managed care organizations are in on the game too. Ohio MCO, Paramount, which is owned by ProMedica, also is limiting distribution primarily to their own specialty pharmacies or CVS/Caremark.
Buckeye Health Plan isn’t much different. Figure 12 shows the language from Buckeye Health Plan’s 2018 PDL:

Figure 12
Source: Buckeye Ohio Medicaid 2018 PDL
To translate, Buckeye is funneling specialty prescriptions (here termed biopharmaceuticals and injectables) to AcariaHealth. AcariaHealth is owned by Centene. Buckeye is owned by Centene. Envolve is owned by Centene.
Actually, the only surprising part to us is why Centene needed CVS/Caremark’s help with PBM services in Ohio the first place. But we needn’t worry much about that anymore because Centene has since dropped CVS/Caremark in favor of its own “game-changing” PBM, RxAdvance. So Centene now owns everything except retail pharmacies.
Centene also then went and acquired WellCare. Why is this important? WellCare was the largest full pass-through MCO in this country. So one of the few beacons of transparency in managed care will soon be absorbed into the Centene empire, and likely sink back into the shadows.
Due to the general lack of transparency on drug distribution trends within state Medicaid programs, it is hard to definitively say where all those Imatinib Mesylate prescriptions – and those $5,000+ margins – are going, but it certainly looks like the pharmacies most likely grabbing them have some interesting ties to the health plans and PBMs that are steering traffic in their own direction. This would be consistent with what was recently discovered in the North Dakota Medicaid managed care program, where state officials found 4.35% of all pharmacy claims were going to two health plan-owned pharmacies, yet those pharmacies received 33.77% of the state’s overall prescription drug dollars.
This poses interesting questions for payers, as it appears to be another instance where those tasked with containing drug costs may actually have conflicting incentives to actually over-inflate costs.
State officials and federal regulators should keep a close eye on the fallout of the rapid and aggressive vertical integration that is happening within the drug supply chain to ensure that these perverse incentives are not resulting in inappropriate margin-shifting and anti-competitive behavior.
Top Overpaid Drugs to Pharmacies in Q3 2018
If you glance back up at the Markup Universe in Figure 9, there were a handful of other large bubbles (i.e. drugs where large markup is likely going to pharmacies) that warrant exploration. It turns out that there are only eight generic oral solids drugs in Ohio that still had a markup per unit of more than $2 (a number we generally consider very excessive) in Q3 2018. As established earlier, these markups below for Ohio are going entirely to the pharmacies that have the great pleasure of dispensing these drugs. We’ve presented this list for you in Figure 13.
Figure 13
Source: Data.Medicaid.gov; 46brooklyn Research
Let’s go through this list and see what else we can learn:
Capecitabine
First, generic Xeloda (Capecitabine 500 mg Tablet), another oral chemotherapy agent, appears to be the same story as Imatinib Mesylate. We have been staring at this drug for awhile, because of some of the eye-popping markups occurring in many states. From what we can tell, just like Imatinib, it is classified by Ohio MCOs as a specialty drug, which means it is likely following the same distribution patterns.
Sildenafil
Next, let’s jump down the list to Sildenafil 20 mg Tablet. This pulmonary hypertension medication is actually also being classified as a specialty drug, and therefore likely flowing through PBM and MCO-owned specialty pharmacies as well. What makes this example unique is that unlike Imatinib and Capecitabine, this drug is very cheap. It’s average acquisition cost is right around $0.20 per tablet.
So why would this be a specialty drug? Our only guess is that Sildenafil 20 mg is not really a drug that’s being prescribed for pulmonary hypertension every time. Through a simple drug manufacturer magic trick, if the dosage strength of Sildenafil goes from 20mg to 25mg or higher, Sildenafil is no longer a cheap pulmonary hypertension drug; it instead morphs into what in 2018 was an expensive erectile dysfunction drug you may have heard of – Viagra.
As we mentioned last week, the release of CMS Q3 2018 State Utilization Data was a cool moment for us, because now, what state Medicaid programs are being charged begins to overlap with our previous drug pricing research. It just so happens that we had been tracking Sildenafil’s pricing movement back in August 2018.
At the start of Q3 2018, Sildenafil 25mg (generic Viagra) carried a NADAC of $27.08 per unit, whereas Sildenafil 20mg (generic Revatio) carried a NADAC of $0.21 per unit (Figure 14).
Figure 14
Source: Data.Medicaid.gov; FDA.gov, 46brooklyn Research
Clearly, there was quite an arbitrage here to buy and dispense the cheap version of Sildenafil and charge the payer some discount to the expensive one. We don’t know if that was happening, but we do know that this drug was considerably overpaid to pharmacies, and again that the PBM and MCO-owned pharmacies likely benefited from that due to Sildenafil’s classification as a specialty medication.
Interestingly, as shown in Figure 15, many states appear to have pricing issues with this 20 cent drug. Eleven states reported paying more than $2 per tablet for this drug in Q3 2018, with Indiana leading the group, paying a whopping $11.35 per tablet! On the flip side, states like Iowa, Washington, and Illinois are paying less than $0.30 per tablet. As another reference point, state Medicaid fee-for-service programs, which are required to set prices based on actual acquisition cost, paid $0.39 per tablet on average for this drug, with a maximum of $0.94 (California). See for yourself using our Medicaid Drug Pricing Heat Map.
Figure 15
Source: Data.Medicaid.gov; 46brooklyn Research
HIV/AIDS Generic Drugs: Atazanavir, Valganciclovir, & Tenofovir
There were three generic drugs that treat HIV/AIDS that fell into the greater than $2 markup/pill range: generic Reyataz (Atazanavir Sulfate 300 mg Capsule), generic Valcyte (Valganciclovir 450 mg Tablet), and generic Viread (Tenofovir Disoproxil Fumarate 300 mg Tablet). Unlike Imatinib Mesylate, Capecitabine, and Sildenafil, these HIV/AIDS drugs have not been classified by Ohio’s MCOs and PBMs as specialty drugs, meaning that these drugs should enjoy a more open, regular distribution.
We’ve been tracking each one of these drugs over the last year:
September 2018 NADAC Survey results show Atazanavir takes a nosedive
February 2019 NADAC Survey results show Valganciclovir continuing its price erosion
Tenofovir Disoproxil Fumarate markups were among the highest in Q2 2018
Despite the fact that these drugs do not appear to have a glaring issue or conflict, we just couldn’t immediately write off three major HIV treatment generic drugs showing up on this list as a coincidence. Being that CVS/Caremark is the predominant PBM in the Ohio Medicaid managed care program, here’s a bit of a rundown of their involvement in the HIV/AIDS space:
We know CVS has an interest in the drug class, as evidenced in their CVS Specialty HIV Care Management program.
The AIDS Healthcare Foundation, who objects to the CVS/Aetna merger, raised concerns over CVS/Caremark coercing patients to use CVS mail-order or retail pharmacies.
There is also a patient lawsuit going after CVS/Caremark steering and mandatory mail-order programs for HIV/AIDS drugs.
Ohio officials awarded a contract to CVS that allowed them not only to control federal money for HIV/AIDS drugs in Ohio, but also to require patients to buy their medicine only at CVS pharmacies.
While these issues are not all directly related to Medicaid managed care, and may have nothing to do with the fact that we found three of the top HIV treatment generic drugs on this list, let’s for the sake of argument concede that CVS/Caremark has more than a passive interest in the HIV/AIDS drug business.
Omeprazole Tablets
The way things tie together sometimes is simply amazing. One of the other drugs that was giving us pause over the last few months was generic Prilosec OTC (Omeprazole DR 20 mg Tablet). Back in December, when we launched our Drugmaker Market Share Dashboard, we began poking around some of the Omeprazole data, because in Q2 2018, our Top 20 Over $20 visualization showed this over-the-counter (OTC) medication had the fifth highest markup per prescription in Ohio (Figure 16).
Figure 16
Source: Data.Medicaid.gov; 46brooklyn Research
As we chronicled at the time, while Ohio was paying more than $280 per prescription through its largely CVS/Caremark-controlled Medicaid managed care program, the drug could be acquired off the shelf for around $15.
We discovered that in Q2 2017, the rate that the state of Ohio was charged for Omeprazole DR 20 mg Tablets started ballooning, primarily due to a growing market share for Major Pharmaceuticals, who was making the most expensive generic version of the drug. The Major Pharmaceuticals version cost 12 times more than all the other other manufacturer versions at the time, but that’s the one Ohio Medicaid managed care was predominantly buying.
As we discovered, Major’s price never really changed over time. It’s just that Ohio’s utilization shifted to this higher cost item, meaning that pharmacies were shifting more patients to the Major version. We’ve updated our Drugmaker Market Share Dashboard with the Q3 2018 data, and as you can see in Figure 17, the problem in Ohio got worse.
Figure 17
Source: Data.Medicaid.gov; 46brooklyn Research
While there were versions of Omeprazole DR 20 mg Tablets being reimbursed at rates of $0.56/unit – or capsule versions being reimbursed as low as $0.06/unit – Ohio Medicaid managed care was paying out a growing share of $6.71/unit for the Major Pharmaceuticals version.
Considering that the only non-CVS/Caremark plan, UnitedHealthcare, specifically only covers the capsule version (which is financially wise), that means that the growing coverage of the expensive Major Pharmaceuticals tablet version is occurring under the watch of CVS/Caremark.
After some great inquiry from Eric Coldwell and his team at Robert W. Baird & Co., the Columbus Dispatch did an excellent deep-dive into CVS/Caremark’s decision to reimburse pharmacies at the higher rates for the Major Pharmaceuticals version, which highlighted some interesting financial ties that CVS/Caremark has with Cardinal Health, who owns Major Pharmaceuticals.
“This is a textbook example of concerns taxpayers have across the nation and (underscores) the need for transparency across the entire drug-supply chain.”
Generic Suboxone
Unfortunately, our home state of Ohio is no stranger to the opioid epidemic that has ravaged the country. And with a heavy problem of addiction comes a heavy dose of addiction treatment. And perhaps no addiction treatment is more popular than generic Suboxone (Buprenorphine-Naloxone 8-2 SL Tablet). We know this drug well, because back in 2017, it became a major point of contention for Ohio pharmacies, when CVS/Caremark cut reimbursements by around 80 percent, resulting in reported dispensing losses of around $100/prescription for what was the most commonly-dispensed drug in the Ohio Medicaid program.
The cuts created such terrible access issues that the Department of Medicaid stepped in and demanded that CVS increase the reimbursement rates – and increase the rates, CVS did – to rates considerably higher than where they were before the rate cut. You can read up on the whole saga here.
“How did you go from negative $100 to positive $80 after rebate? What costs are you even using? You weren’t using any. That’s the thing. You just pick another number to stop people from bitching, but you’ve done nothing to address the real issue. It’s just how much do I have to pay you to get you to shut up?”
Of course, all this fuss begs the question of how these reimbursement rates are set in the first place (as well as how much spread was being captured during the Q4 2017 cuts), but as you can see in Figure 18, political pressure has a strange way of making things change.
Figure 18
Source: Data.Medicaid.gov; 46brooklyn Research
Have we really fixed anything at all?
So thanks to Ohio, we are all now a bit smarter about spread. But as is often the case with our “random walk” work and writing, we didn’t end up where we expected when we set out to analyze Ohio’s Q3 2018 State Utilization Data. We didn’t expect that this report would be less about the drugs that experienced a large drop in unit cost and more about the drugs that did not experience a change in cost. And we certainly didn’t expect that by studying the drugs that didn’t change in cost, we would end up highlighting some disturbing examples of the conflicts of interest that we are going to have to contend with more and more as the drug supply chain continues to vertically integrate. But that’s data analytics for you – the data will take you to some interesting places that we certainly are not smart enough to forecast.
One thing that’s easy to forecast is that this supply chain is not going to provide the sort of transparency we need without putting up a fight. Consider Ohio’s reporting change. We now have “transparency” into what pharmacies are getting paid in Ohio, but that just means that we have no idea what PBMs are taking in administrative fees. At least before the data reporting change, we could use State Utilization Data and NADAC to calculate the full markup (including both PBM and pharmacy margin) on any given generic drug. Now, at least for Ohio, all we’ll be able to calculate is the pharmacy margin over NADAC. Where did the PBM revenue go? Back to the shadows… expunged from what we would argue is the most helpful public data source available to assess detailed Medicaid drug spending.
Long story short, selective transparency is not going to work, at least not for a supply chain that is so shrouded in secrecy today. As we see here, making a change to bring transparency to one thing just buried something else even deeper. This isn’t going to get us where we need to go. Ultimately, the goal here is to spur healthy competition up and down this overly-secretive supply chain – from manufacturers to PBMs to pharmacies. How can that ever be done without knowing what each part of the supply chain charges for their services and/or products?
Note: We noticed a typo on Figure 5, and corrected it on April 29.