
This drug pricing distortion was supposed to go extinct. It’s never been more alive.
This summer, we launched a new research work that examined the costs yielded by a reborn and evolved species of the prescription drug supply chain: drug companies who are also part of larger vertically integrated pharmacy benefit manager (PBM) corporations. In essence, PBMs are intended to be a structural friction against the desired prices charged by drug manufacturers, so when the companies that are supposed to be the price-fighters become the price-setters, traditionally-assumed incentives become blurred at best and spun into reverse at worst.
More recently, fellow drug channel archaeologist Adam Fein recently also wondered what PBM-owned drug companies list price behavior might tell us about the incentives within the U.S. drug pricing system. A newly published paper from researchers Michael Carrier and Rachel Sachs further explores the competitive concerns and seeming misalignment of PBM incentives.
So while our study from this summer dug into the publicly-available data that shows the output of the costs reported in the Medicaid, Medicare, and Commercial markets for medicines produced by one specific PBM-affiliated drug company, Quallent Pharmaceuticals, it is worth noting that the reported end costs of these medicines don’t tell the entirety of the story – specifically, the beginning.
As the PBM trade group, the Pharmaceutical Care Management Association, often reminds us, drug pricing realities begin with the setting of the list price of medicines by drug companies. In fact, in the ongoing food fight in DC and the states over who is to blame for high drug prices, PCMA has drawn such a line in the sand, they have even launched their own web portal – lowerthelistprice.com – in an effort to demonstrate the PBM industry’s desire for drug companies to lower the sticker prices of their medicines. As they put it, “the price is the problem when it comes to Americans facing difficulty affording their prescription drugs.”
As long-time industry researchers, we understand that drug affordability is a complicated problem with many cooks in the kitchen that can impact the end cost of a medicine. And while the list price of a medicine is certainly a key ingredient, we know that often, the list price can be an illusion of sorts, due to its frequent disconnect from the true underlying cost of the drug or the cost experienced by the end payer.
Regardless, Fein’s query on PBM-drug company list prices and the recent public relations offensive of the PBM trade group professing their devotion to low list prices were enticing enough for a thorough examination of the list prices of medicines – both those that are set by PBM-affiliated drug companies and those set by standalone drug companies.
If large PBMs truly want lower list prices for prescription drugs, then when their parent corporations own a drug company that sells and sets the prices for their own labelled medicines, one would assume that with maximum control over the price, the PBMs would be able to fulfill their own wishes for the low prices they demand of the pharmaceutical industry – the ultimate opportunity to put their money where their mouths are and fulfill the old adage, “if you want something done right, you have to do it yourself.”
In today’s new report, we build on the learnings of the past and dig deep into the foundational DNA of a rare but re-emerging species of drug channel creatures known as “pseudo-pharmas” or “PBM private labelers” to assess what happens when the finger of blame for who creates drug pricing reality ends up getting pointed at someone at the same company town hall meetings.
Background: “You know, at times like this, one feels, well, perhaps extinct animals should be left extinct.”
Like field paleontologists brushing desert sand from bone shards, evaluating prescription drug prices can feel like a grueling excavation into ancient eras. This is because discussions on drug pricing generally occur in regards to reference drug prices; things like Wholesale Acquisition Cost (WAC) or National Average Drug Acquisition Cost (NADAC). WAC can inform us about changes brand manufacturers are making to drug list prices (i.e. the prices “set” by manufacturers that are usually referenced in news stories about drug manufacturer prices and whose changes are chronicled on our Brand Drug List Price Change Box Score), and NADAC can describe what pharmacies are paying to acquire drugs (pharmacies typically buy drugs from wholesalers and those reported prices are tracked via NADAC, which is chronicled on our NADAC Drug Pricing Dashboard).
While WAC and NADAC both have their limitations, they are critical tools – backed by public policy and methods that give legitimacy to their usefulness – to assess the environment with which prescription drug costs exist. Yet despite the reliance that manufacturers, wholesalers, pharmacies, media, researchers, and Medicaid programs have on WAC and NADAC, these benchmarks tend not to be the ones referenced in drug pricing contracts that ultimately govern how prescription claims are negotiated or how actual cost is experienced for patients and plan sponsors. More simply put, two of the best measures that exist to evaluate drug prices generally aren’t even used in the contracts that determine the actual prices paid for medicines.
So, if you want to move away from the headlines and research papers and get closer to the place where drug pricing reality in the market is forged, you have to dig into the contracts that negotiate that reality. And if you are fortunate enough to see those contracts, you will likely pick up on the need to excavate an economic fossil record of another drug pricing benchmark: Average Wholesale Price (AWP), which is essentially an even more inflated sticker price of sorts with no policy-backed, objective definition and no meaningful, consistent alignment to any other pricing benchmark in the system. In the pharmacy world, you may hear it referred to as “ain’t what’s paid” or “a wrong price.” We’ve often referred to it as “always what’s profitable.” Regardless of what you call it, when it comes to traditional PBM contracts, AWP is everywhere.
So despite the importance of all other pricing benchmarks (and the ones we typically rely upon at 46brooklyn), AWP arguably matters more than anything, because the vast majority of contracts that negotiate drug prices are tied to AWP-based payment terms. For example, those contracts that can be found in the public domain tie drug reimbursement to AWP-based discounts:
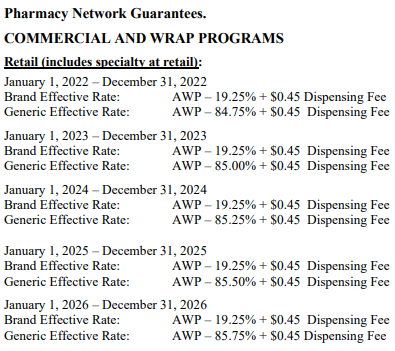
Figure 1
Source: City of Mesa, AZ
And now feels like a good point to let our readers know that we’ve updated 46brooklyn.com to include more resources that will be relevant for this report. Whereas before we had a glossary tab at the top of our web page where users could find definitions to key pharmacy terms or acronyms, we’ve revamped that tab to be a broader resources hub. The resource tab retains the 46brooklyn glossary of pharmacy terms but also includes a link to a bunch of publicly-available drug channel contracts that we have scoured from the internet. And if you go to the Resource Tab on the top banner and click on the Drug Channel Contract button and browse the various contracts we’ve found, you’ll notice a AWP-based payment term theme. (Note we also added to the Resource Tab a link to Public Drug Pricing Data Sources we use for our work as well; though that doesn’t really come up in this report we figured we would let you know that is there too)
Is it wrong to tie drug pricing to AWP? That is largely a matter of perspective. Each stratum of this long‑buried benchmark preserves a story about how list prices were set, who profited, and why those figures still shape reimbursement long after the marketplace itself has evolved. Yet, just as a Tyrannosaurus imprint is no guide to the metabolism of a sparrow, the AWP embedded in pharmacy contracts tells us little about the real costs of modern dispensing. Worse, its petrified numbers can still bite.
AWP is the oldest drug pricing benchmark. Created in response to a California Medicaid pharmacist’s desire to help pay for prescription drugs, the 1970 edition of Red Book was the first to publish AWP prices. According to the work of Ernst Berndt and Joseph Newhouse at the Harvard Kennedy School of Government, the 1970 edition of Red Book carried the following description of AWP:

Figure 2
Source: Harvard Kennedy School
Soon after the publication of AWP by Red Book, their competitor, the American Druggist Blue Book, also began publishing AWPs. Perhaps unsurprisingly, as more and more health plans began offering prescription drug insurance, AWP became the dominant benchmark in terms of directing how drug prices were paid from the 1970s onwards. It was the case that during the 1960s, it was uncommon to have prescription drug coverage (approximately 4% had it), but that it increased over time with nearly all employers eventually offering health coverage including prescription drug benefit coverage as part of their offerings.
At the same time, it was knowable quite early on that AWP wasn’t that reliable of a drug pricing benchmark (if the goal of the benchmark is to understand the acquisition cost of the drug being sold; which it may or may not be depending upon your perspective). As early as 1974, the U.S. Department of Health, Education and Welfare put into the federal notice a warning that “Red Book data, Blue Book data (i.e. AWP) and other standard prices…were frequently in excess of actual acquisition cost.” In 1984, the Health & Human Services Office of Inspector General identified that most pharmacies purchased drugs 15.9% below AWP, with some being as much as 42% lower than the drug’s AWP. As HHS OIG stated at the time, “‘Average Wholesale Prices’ (AWPs) reported in the Red and Blue Book compendia were, for the drugs studied, in excess of actual acquisition prices.” In 1992, HHS OIG went so far as to identify that, “[T]here is no single discount rate which can be applied to AWP to provide a reasonably consistent estimate of physician’s acquisition cost.” And yet, AWP-based pricing continued into the 1990s and early 2000s.
At the start of the twenty-first century, the drug compendia First Databank (who had acquired the Blue Book from the American Druggist) and the wholesaler McKesson were alleged to have engaged in a scheme to raise AWP prices (we say this because they eventually settled the resulting lawsuits and expressly denied liability of any kind). This alleged activity, once discovered, was a cataclysmic event at the time. One could say the strata of our drug pricing history bears its own dramatic “K‑Pg boundary” from the mid‑2000s, when plaintiffs unearthed evidence that publishers and manufacturers had quietly widened the markup from WAC to AWP (Can you tell we watched Jurassic Park more recently than our beloved Star Wars?). If you were someone who paid for prescription drugs in reference to AWP (which to be clear was effectively everyone), this AWP-markup increased the price of medicines and undermined credibility in the benchmark and system as a whole. As the Wall Street Journal put it at the time, “The term [average wholesale price] is a misnomer because it no longer represents a price paid to wholesalers and is not an average of anything.” (Note, we’re not sure it EVER actually did represent a price paid to a wholesaler, but we digress)
In 2009, a federal court oversaw the resulting settlements of this AWP-based lawsuit, which included FDB’s decision to roll back the spread for hundreds of brand drugs back to a uniform 1.20 × WAC and to retrofit thousands of other National Drug Codes (NDCs) to the same ratio. The ruling reminded the market that AWP was never an “average” at all — merely a multiplier — yet even this carefully chiseled correction did not erase the benchmark; it simply reset the fossil clock.
In 2009, Adam Fein published a blog post questioning what the world would look like after AWP went boom. At some point after these lawsuits, legislative investigations into AWP appear to have dried up – maybe under the belief that AWP did in fact go boom. And who can blame anyone for trusting that the coast was clear? At the time, it was believed AWP distortions would be a thing of the past, largely due to the immense size of the settlements and just the obviousness of AWP’s flaws. For example, in her March 2009 order and opinion in the seminal AWP case, Judge Patti Saris’ blunt assessment of AWP’s true essence would lead many to believe that the jig was up for good when she stated, “AWP has been exposed as a faux inflated price unrelated to actual drug prices. Reliance on AWP is a trap for unwary and unsophisticated TPP purchasers and results in consumers paying unwarranted co-payments. Not only do FDB and Medi-Span have the right to make these changes, but in my view, after eight years of this MDL, rolling back AWPs or phasing them out as a pricing benchmark is in the public interest and to the benefit of the class.”
As a brief aside, it may be helpful (or at least it comes up in conversations we have) to think of AWP in the same line as LIBOR (London Inter-Bank Offered Rate) in finance and real estate. LIBOR represented the average interest rate major banks claimed they would charge each other for short-term loans. As discussed with AWP above, this isn’t that different from AWP which represents this price “designed to show the average price retailers throughout the country are paying to the wholesaler for a particular item” - see Figure 2 above. If AWP is this reference price used for prescription drug reimbursement, particularly in the insurance space, and LIBOR served as this global benchmark of interest rates for which major banks borrow from one another, then the parallel is that both act(-ed) as anchor points for transactions even though neither necessarily reflect true market conditions (said differently, both are numbers that thousands of transactions depend(ed) on to determine what should be paid or charged). Of course, much like AWP was found to potentially be inflated, LIBOR was discovered to not always reflect actual transaction prices and rather was ‘estimates’ submitted by banks. Banks which stood to benefit from tweaking their submissions to LIBOR can speak to the potential value that can be gained from perverse incentives to influence or manipulate the underlying benchmark used in complicated financial transactions (be they real estate or prescription drug benefits). In other words, AWP in healthcare and LIBOR in finance show how convenient but opaque reference benchmarks can dominate markets, yet become vulnerable to distortion and exploitation.
But in a tale as old as time, the drug channel took its licks in the litigation fallout and eventually found ways to facilitate similar yields with slightly modified financial logistics. Today, we know that AWP didn’t actually go extinct, and that most contracts today continue to “control” drug prices with AWP-based terms.
Fast‑forward to the present day, where three private‑label drug manufacturer “species” have emerged from the PBM ecosystem: CVS Health’s Cordavis, Cigna/Evernorth’s Quallent, and UnitedHealth/Optum’s Nuvaila. As we highlighted in this summer’s report, these three companies represent what we know to be the strongest environment in existence to control both the front-end and tail-end of a pharmacy transaction, as the same parent company owns the manufacturer/labeler that sets the list price, the PBM who negotiates the end payment to the provider, and the pharmacy that pays to put the drug on its shelf and receives that end PBM payment.
So, if AWP is ultimately the primary pricing benchmark with which drug prices are negotiated by PBMs — and PBM-affiliated companies have the power to set the AWPs of their own drug products — we now have an unprecedented opportunity to evaluate the pricing of these products and to see what they can teach us about drug pricing in the modern era. Further, we can examine what the behaviors of companies who claim to be universally and solely working to lower drug prices may actually reveal about their underlying biology.
Quallent’s AWP fossil record: “That’s the great thing about bones. They never run away.”
As we mentioned in this summer’s report, Cigna/Evernorth/Express Scripts’ drug company Quallent Pharmaceuticals has the most expansive portfolio of drug offerings under its label of the PBM private labelers (at least at the time of writing this), and thus, it will be the primary focus again of today’s report as well. At today’s metaphorical drug pricing dig site, we gathered up the AWP, WAC, and NADAC price points for all Quallent products from Elsevier’s Gold Standard Drug Database at the end of June 2025. We used this product list to also find any equivalent products on the active ingredient, dosage form, and strength (i.e., because Quallent has their own version of abiraterone 250mg tablets, we gathered up all other abiraterone 250mg tablet products from other manufacturers as well [and we did this for all the rest of the products as well]). The following Figure 3 tries to outline the population of drug products we’re looking at.

Figure 3
Source: Elsevier’s Gold Standard Drug Database
What Figure 3 above is trying to tell you is that we have almost 6,000 NDCs we’re analyzing, across 124 unique active ingredient/dosage form/strength combinations, across 49 unique active ingredients, and three different dosage form types. Almost all the dosage forms we will focus on in this report are simple tablets or capsules (as the injectable biosimilars have been covered extensively by others elsewhere).
Now, we would love to be able to just tell you all the prices to the penny; however, we cannot do that. For whatever reasons, AWP and WAC are considered proprietary prices, and so we technically cannot tell you what exact price goes with what drug. And while that is ridiculous that even in a system where we know the list prices for medicines are inflated and essentially both real and fake, it is appropriate for our fossil record analogy. Just as we’ll likely never know what dinosaurs actually looked like (were they green and scaly or covered in vibrant feathers?), this report will have to tell you the outline of what we’re observing. However, we can describe the universe of prices we’re observing as a kind of impression of the hollowed out place where the metaphorical drug pricing bones fell in the soil — a fossil that we can hopefully fill in enough of the gaps with to get the shape of what the reference prices look like for these drugs.
We start by trying to put together an assessment of where the AWPs for a given product fall. To do this, as shown in the below gallery, we plot the characteristics, on an AWP-basis, for the 124 products (active ingredient, dosage form, strength) we can examine. For each active ingredient across all drug companies/labelers, we outline on a dosage form and strength basis the minimum observed AWP per unit (green dot), the median AWP (purple), the average AWP (grey), the Quallent AWP (blue), and the maximum AWP (red dot). You’ll notice that in order to maintain the proprietary nature of the specific prices, the axis of all graphs are hidden (some have unit prices that are pennies per units, whereas others have prices that are thousands of dollars). While everything is appropriately scaled so that you can get the fossilized impression and relative scale of what we’re seeing, we cannot actually tell you the AWP for any of the 49 active ingredients in our gallery below, but even so, we think you’ll walk away with some meaningful learnings from what we’ve put together:


If you scroll through the gallery, we believe you’ll walk away with the idea that Quallent is generally on the higher-end of AWP values for the products in question and rarely at the lower end. If we could show you the the exact prices, you’d see that Quallent is, on a product-level average, 33-times more expensive at the AWP basis than the cheapest AWP option for any of these therapies. At the same time, Quallent is, on a product-level average, 83.8% of the maximum AWP-based price. Further, there are no products where Quallent is the lowest AWP price point, but a handful where they are actually the most expensive.
In case it is helpful, the following table gives characteristics of Quallent prices as either the multiplier from the minimum price or what percentage of the maximum price Quallent’s price point is (it’s the best we think we can do without telling you the actual prices):


In an ecosystem where AWP is a predominant basis for determining the drug pricing experience of the end payer (see payer contracts we found), high AWP prices would appear to either confer high cost onto those end payers and/or provide higher revenues to dispensing pharmacies. This is because if you live in a world of AWP-based discounts determining your drug pricing reality, then an 85.5% discount off of a higher number will result in a bigger number than that same 85.5% discount off of a lower number.
In case the math isn’t clear, consider two identical products: one with an AWP of $100 and one with an AWP of $1,000. In a world where drug cost is determined as an AWP-based discount, say AWP minus 85.5% (the 2025 generic drug discount in the City of Mesa contract we led this report with), then the payer will spend more and/or the pharmacy will make more money dispensing the $1,000 AWP product relative to dispensing the lower price product. For you shoppers out there, imagine you are a department store like Macy’s or Boscov’s, and you have a customer with a 60% off coupon with two pairs of pants, where one pair has a sticker price of $50 and the other has a sticker price of $150. After the coupon discounts each respective purchase, the two pairs of pants yields the department store $20 and $60. And while you wouldn’t normally buy the $150 dollar pants, if you can get them for effectively $60 with you’re coupon, maybe you would. Ergo, more actual dollars can be harvested off items with higher sticker prices.
We make this observation as it would seem counter-intuitive to some when thinking about the structural incentives of the drug channel. By basing contracts in AWP-linked pricing, aren’t you incentivizing higher — not lower — prices? By basing pharmacy benefits contracts in AWP, it would appear interesting behavior for a PBM-owned drug company to set relatively high AWP for their drug products (given PBM claims that they’re the only one working to lower drug prices).

We guess from a certain point of view, by setting high average wholesale prices for the medicines they sell, it provides the opportunity to provide relatively larger discounts to AWP for those products, but is that actual lower prices or just the perception of lower prices?
Look, if you’re a reader of 46brooklyn, you know that we are not fans of fake, artificially inflated drug prices (of which AWP is the embodiment of that behavior), so we may already be prone to negativity when it comes to evaluations of AWP-based price points. We think the above analysis is a fair characterization of the observed behavior, which in simple terms is this: PBMs contract with plan sponsors in a way that offers aggregated discounts off of AWP. They also will contract with pharmacies and pay them as an aggregated discount off AWP. Through their parent company’s private labeling business, they can actually set the dollar value of whatever AWP is. So by setting a higher AWP, it devalues the nature of its contractual discounts in ways that can inflate costs to their plan sponsor clients and provide increased margins for the pharmacies dispensing medicines that reflect those high AWP values.
But this ain’t our first drug pricing excavation, and we are well prepared for the typical pushbacks, excuses, and proverbial shooting of the messenger. So let’s take this further (because this report isn’t long enough) and re-do the analysis above, but this time, instead of evaluating AWP-pricing behavior, which lacks a federal definition for what it is and what it’s supposed to represent, let’s turn instead to Wholesale Acquisition Cost (WAC). As a pricing benchmark, WAC has a federal definition (in short, WAC is the list price between manufacturer and wholesaler transaction), and so when we evaluate these prices, we can at least know that it represents something (even if the only thing it represents is an artificially inflated list price that does not reflect rebates and other related discounts, but at least WAC is something — not the quasi-nothing that is AWP). So let’s dig deeper into our drug reference pricing sandstone.
The next layer: Quallent’s WAC pricing fossil record
If we re-do the earlier AWP gallery with WAC, we get the following images of WAC pricing for Quallent products. Again, if you scroll through this below image gallery, we think you’ll walk away with some further learnings (even if we can’t talk about the actual prices):


We believe the impression you’ll get from the above gallery is the exact opposite behavior that we saw for AWP with Quallent products. On a WAC basis, Quallent products are on a product-level average just a 3.4 fold multiplier above the lowest WAC price and just 15% of the maximum WAC price for these products (as a reminder, these same characteristics were higher when we were assessing AWP-based behavior, 33-fold the AWP min and 83.8% the AWP-max price). We do not know what the dynamics actually look like when you effectively sell something to yourself, but we find it telling that the behavior of Quallent’s WAC — which is the list price for them to sell/buy to themself (at least that is what the federal definition of WAC tells us it represents) — is on the low end of observable WAC prices for a given product, but when Quallent sells to others, the list price (AWP is the basis for most payer contracts) is on the high end of observable prices. Again, we draw your attention to our resource tab - look at the Express Scripts contracts we’ve found - you’ll see they’re AWP-based contracts by and large (and we acknowledge, we don’t have every ESI contract but from what we’ve gathered we see a trend to AWP).
Again, to try to observe this behavior more directly — but not as directly as publishing the price (because we can’t publish WAC prices either) — when we look at the multiplier of the Quallent products’ WAC price relative to the lowest available WAC in the market, or the their products’ WAC price as a percentage of the maximum WAC prices available in the market, we see an entirely different animal than what we saw with the AWP-side of things.


As you can see in the above, while Quallent’s AWPs (earlier in this report) were consistently many double-digit multiples of the minimum AWP or 70%+ the maximum AWP, when it comes to WACs, their products are almost always smaller (both as a multiple to the minimum or a percentage of the maximum).
If you’re a fan of dinosaurs, trying to picture what these creatures actually look like is a big part of being a dinosaur fan (we asked our kids and they confirmed that this is part of the kid code or something). However, if the beaver tail is any indication, we would likely be surprised to discover what Dinos actually look like. All of this is to say, what are we to make of the widely different perspectives on where Quallent’s drug list prices fall based upon whether we contextualize their price in an AWP-based manner or in a WAC-based manner?
Or saying it differently, if you are going to try to construct an image of what a drug’s price truly is, but the basis of your construction of that price is AWP, you are doomed to get it wrong effectively 100% of the time. To demonstrate this, we decided to revisit our favorite dinosaur drug-equivalent — imatinib.
Our favorite dinosaur: Imatinib Mesylate
If you’ve not followed us from the beginning, you may not realize that the first thing 46brooklyn wrote back in 2018 was about imatinib mesylate (generic for Gleevec). Back in the day, Gleevec was a wonder drug, fundamentally changing the way we treat blood cancer. In the time before Gleevec, chronic myeloid leukemia (CML) was a blood cancer that had a very poor prognosis. After Gleevec came to market, the success rate of treating CML skyrocketed — literally saving lives. Gleevec was first approved by the FDA in 2001 with the first generic being approved in 2016. And while undoubtedly, the brand manufacturer of Gleevec, Novartis, made a bunch of really nice profits off of a medication to treat cancer (estimated $4 billion in annual revenue from the drug by 2010), the generic market was supposed to deflate the price after the brand had made all its money.
And so you can imagine our dismay when we originally strung together drug pricing and payment data back in 2018 and saw that generic Gleevec was often associated with large mark-ups on cost (continued big thanks to our local Columbus Dispatch for their foundational reporting that gave our early work life, Bob Herman for the original national shout-out, and the incomparable Robert Langreth for the issue validation). Our observations were such that this treatment for cancer was likely thousands of dollars more expensive per prescription than it would otherwise have been if pricing based on the actual acquisition cost of the drug had prevailed (much like Cost Plus Drugs or NADAC-based models that some PBMs and many Medicaid programs are doing today). At the time, we didn’t understand AWP as well as we do today (give us a break, we were still in drug pricing padawan training).
Back then, we were naive enough to think that if knowledge of this pricing markup was published and understood by the broader payer market and/or regulators, it would go away. Of course, that is generally not what has happened, despite the multitude of public awareness opportunities borne out of our own work, cost-plus pharmacies, the Federal Trade Commission (FTC), Congress, and media, we still often see cancer patients and/or their plan sponsors paying high prices for an imatinib product that has become incredibly cheap for pharmacies to acquire. We’re talking about people paying thousands of dollars for something that is commonly being sold for less than $50 outside our typical convoluted drug distribution channel. So we revisit imatinib today, because it likely can help us understand the importance of AWP & WAC pricing in a manner that our aggregate view may not.
If we look at the imatinib example from our last report, we observed that in 2023, the highest priced per-unit imatinib product was Quallent’s:
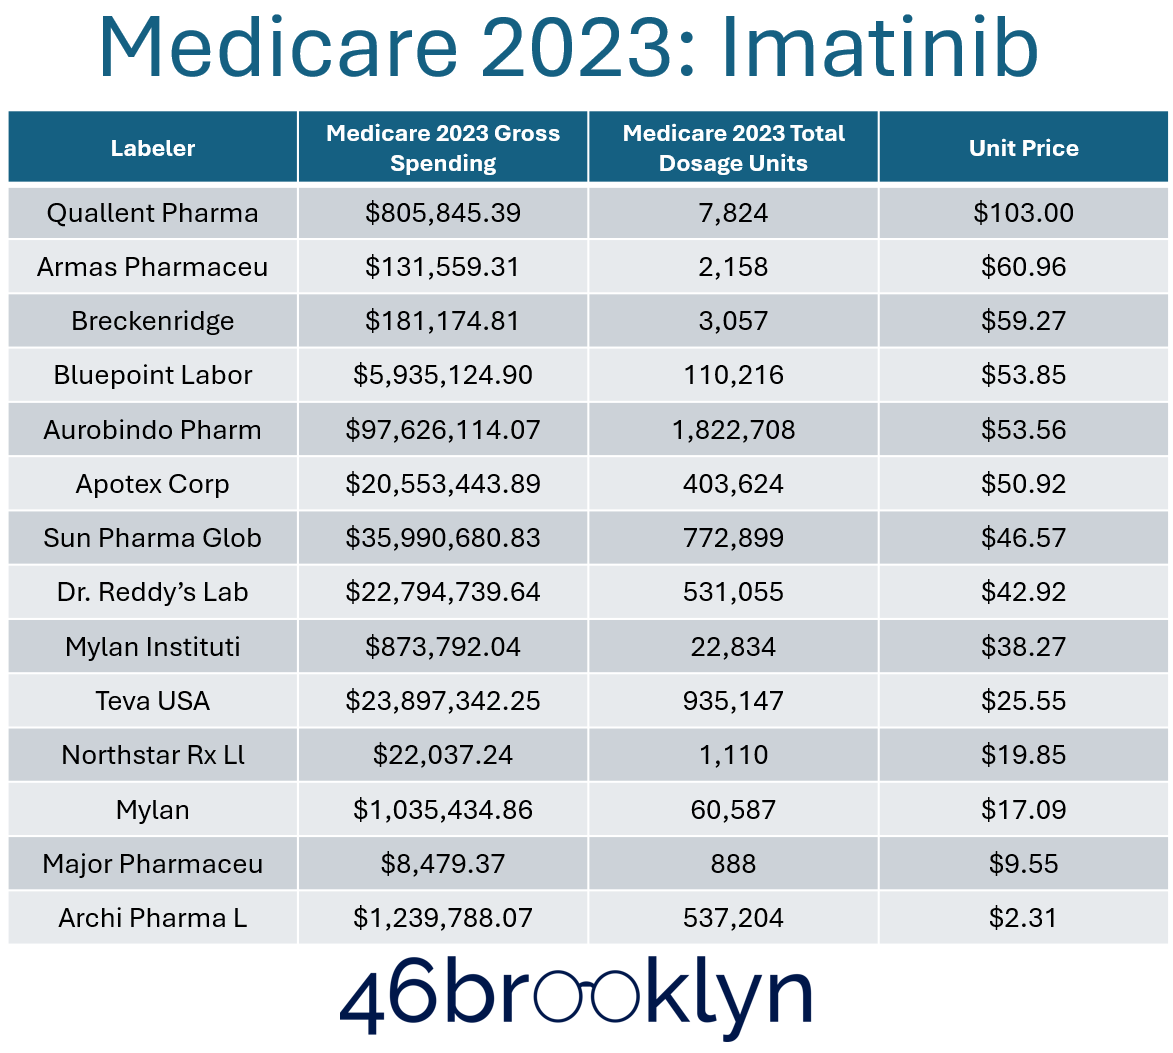
Figure 4
Source: 46brooklyn Medicare Part D Dashboard
And if we look at our imatinib AWP chart from the above gallery in this report, we see that Quallent is almost, but not quite, the most expensive imatinib product in the market on an AWP-basis for 400 mg strength (and maybe for the 100 mg):

Figure 5
Source: Elsevier’s Gold Standard Drug Database
Of course, if we look at Quallent’s WAC price, we can see that it is on the low end of the market.

Figure 6
Source: Elsevier’s Gold Standard Drug Database

Knowing these data points, and recognizing the importance of AWP in terms of determining the amounts charged to plan sponsors, may help explain why Medicare’s observations were what they were in this summer’s report on Quallent product costs across payer markets. If a PBM’s payer contract for imatinib is determining drug prices in reference to an AWP-based discount, it stands to reason that if Quallent’s imatinib is one of the highest AWPs, its yielded negotiated price will be at the top; especially if the only realistic way to get a Quallent imatinib product is from the PBM-owned pharmacy (i.e., less other variables, like individual maximum allowable cost (MAC) rates or unique discounts are likely less relative to other labelers).
We can see some confirmation for this if we look at Archis Pharma’s AWP (listed as “Archi” from CMS’ Part D Dashboard). Archis Pharma has the lowest AWP unit price for imatinib products across the 20 labelers in our database and across the dozen labelers used in Medicare. So by the inverse logic of that for Quallent, it stands to reason that Archis would be associated with the lowest Medicare price as a function of its substantially lower AWP. Again, if both products are subject to an AWP-based discount to determine pricing, then it stands to reason that the lower the AWP price, the lower the end cost to the end payer.
A couple additional observations before moving on:
In a traditional market, if a product class of interchangeable products with immaterial and indistinguishable differences has multiple suppliers already, one would reasonably assume that if another supplier entered the market, their pricing would have to be within the range of existing suppliers, or more likely, even cheaper. After all, how else could a new supplier attract purchasers if they entered the market with essentially the same product but at anything but a more competitive price? This would be especially true given PBMs’ stated affinity for low prices.
Well, Quallent’s pricing decisions appear to defy those reasonable expectations. Quallent’s imatinib came to market in 2023 amid a marketplace that already had 10 versions already being supplied by other drug labelers (based upon date of each labeler’s first WAC price in Elsevier GSDD). Quallent’s imatinib launch even came after Archis, who had entered the market in 2022. Despite this competitive environment, Quallent actually came to market with a higher AWP — one that was around 17% more than the average of all available manufacturers of imatinib at the time and 7,000% more than Archis (based upon the 400 mg strength).
Additionally, we note that although Archis did have more utilization in Medicare in 2023 (see dosage units in Figure 4), it wasn’t the most utilized product despite having the lowest price. Furthermore, when we consider what total gross Medicare spending looks like, Archis products grossed about $1.2 million in Medicare, whereas Quallent products grossed $800K, but Quallent units were more than 70-fold more expensive on an AWP-basis than Archis — essentially meaning Quallent and their distributing pharmacies (i.e. pharmacies owned by Quallent’s parent company) made a lot of money for relatively little volume of work (i.e., dispensed prescriptions) when compared to peer interchangeable products.
However, these observations of the differences between Quallent and Archis may miss the broader point. What if we told you there was a similarity between Archis’ and Quallent’s imatinib pricing that isn’t immediately clear from what we’ve told you thus far? It turns out that Archis’ and Quallent’s imatinib have the same, low WAC price. The divergence is in their AWP price, and that difference gets at the heart of perhaps what Adam Fein’s query at the start of this report is getting to.
AWP-to-WAC ratios: “Hold on to your butts.”
If you go back to the background section of this report, or if you lived in the drug pricing space during the time of the old AWP lawsuits, you may think that there is one universal truth to the relationship between AWP and WAC. You may think that following the First Databank rollback and the lawsuits more generally that all drugs have a AWP-to-WAC relationship whereby the AWP is 120% (1.2x) the WAC. However, that would be a mistake, as that AWP-to-WAC relationship generally only applies to brand-name products (not generics). And if you don’t realize that AWP-to-WAC is not a fixed ratio for most drugs (generics make up nearly 90% of all drug transactions), then the manner in which prescription benefits are secured in a contract can result in outcomes you may not expect.
To start, we should recognize that drug pricing historically functions much like any other transaction in the broader consumer market whereby sellers of products are looking to buy low and sell high as a means to maximize profit. Even in cost-plus pharmacy reimbursement models, the goal is for the pharmacy to sell at above the cost it took to acquire drug inventory and process and dispense the prescription (i.e., pharmacies want — and need — their selling price to be higher than their purchase price). However, AWP can juice the system in ways that people may not appreciate if they’re not familiar with its true nature and the incentives it can create for prescription transaction stakeholders. Consider the relationships between AWP-to-WAC for Quallent’s products, arranged in Figure 7 below from high-to-low.

Figure 7
Source: Elsevier’s Gold Standard Drug Database
While there are two products at the 1.2 AWP-to-WAC ratio within Quallent’s portfolio (those on the far left of Figure 7), the rest of Quallent’s products are many times greater than the 1.2 AWP-to-WAC ratio. The average ratio, on a product basis, is approximately a 38-fold ratio (meaning the AWP price is 38-times higher than the underlying WAC price). At the extreme, four products have an AWP-to-WAC ratio above 100x, with the highest being 200-fold.
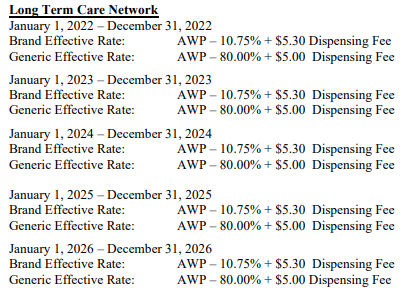
As a result, the ability of a plan sponsor’s AWP-based contract to price medicines ‘reasonably’ largely depends upon what versions of those medicines are being sold through their pharmacy benefits program. Consider again the example City of Mesa contract we referenced at the beginning of this report (embedded again here).
Focusing on the brand payment, and knowing what we know about AWP-to-WAC relationships, this contract states that the City of Mesa’s resulting negotiated drug pricing experience from their PBM should be in excess of what most consider to be the manufacturer’s list price, which is WAC (yes, both AWP and WAC can be considered list prices when using shorthand, but in general, when lawmakers, reporters, researchers, etc. refer to a list price, it is almost always is WAC).
Consider, for example, a brand-name drug with a $100 per unit WAC price. At a $100 WAC unit price, we can reasonably assume the AWP of this product is $120 per unit (given the 1.2 multiplier established from the AWP lawsuits). Well, if the payer’s contract with the PBM states that the PBM’s brand effective rate guarantee is going to be AWP-10.75%, then for this hypothetical product, we can anticipate spending $107.10 per unit on this product (or approximately 7% more than the manufacturer’s WAC list price). Was it the manufacturer’s list price that was responsible for spending above list price or was it the PBM contractual mechanics or both? We’ll let you ponder that one. Note we’ve previously observed price points above WAC for brand prices in Medicare and this observation may help explain some of those observations.
And if you follow all that, what does our AWP-to-WAC relationship potentially tell us about generic drug pricing? Again, if there is a generic product with a $10 WAC unit price, and we assume (probably mistakenly) that the same 20% mark-up applies to its AWP, then we would anticipate that an AWP-based generic discount of 80% would mean a plan would pay just $2.40 per unit on this product (or 76% below the WAC price). However, what if the AWP-to-WAC ratio is 38-to-1 (the average AWP for Quallent’s products in this study) or approximately 200-to-1 (the top end of Quallent’s AWP-to-WAC ratios in their product portfolio). At these more significantly disconnected ratios, a plan sponsor’s AWP-based discount of 80% now means they’re paying $76 per unit or $400 per unit (38 vs. 200 multiplier respectively). Under such context, the importance of the multipliers comes more into focus. The multipliers mean getting a good perception on drug pricing can be difficult, as the actual multipliers are higher than we might expect (would you expect a 200-fold difference?), and even the most attractive-looking discounts may be insufficient to make up for this gap.
To put more plainly, and using hypothetical numbers to demonstrate, if you have a generic drug that has a $100 WAC and a $2,000 AWP being managed under a contract that is producing an AWP-80% discount on generic drugs, on paper, the PBM would have saved $1,600 off the AWP — a massive savings considering the sticker price. But from an alternative perspective, one would expect pharmacies to be acquiring this drug below WAC, so less than $100. Assuming pass-through payments, meaning no spreads or hidden PBM markups between the price the pharmacy is paid vs what they charge the plan sponsor, that would mean the pharmacy would be paid $400 for a drug that that actually cost less than $100. Considering that the average pharmacy needs just around $10 in margin per claim to break even on their overhead, a $300+ markup isn’t a deal; it’s arguably a rip-off. So if you’re sitting there wondering why a PBM’s affiliated drug labeler isn’t setting AWPs at or below the lowest levels in the market, and if you’re wondering why the PBM’s affiliated pharmacies are stocking a product with such a high AWP, and if you’re wondering why the PBM isn’t refusing to cover a product with such a high AWP or at least finding a different cost-based way of achieving a negotiated price, perhaps an answer is that if all these entities are under common ownership, vertical integration isn’t being used for efficiency but instead for profit maximization. Gasp,right?
Look, we already mentioned it in our last report, but it bears repeating here. We should not lose sight of the fact that at the same time Quallent is setting these prices for products like imatinib, other groups like Mark Cuban Cost Plus Drug Company had the ability to give you an entire year’s worth of the medication for less than the price of one Quallent-sourced prescription (at least with imatinib as our judge). While it is interesting to contemplate the true intent that drive these kinds of financial outcomes — although perhaps the FTC dropped a good hint — rather we think it is far more worthwhile to focus the failure of our system to incentivize the things we want it to actually do.
For the removal of doubt, we do not think Quallent is alone in following these trends. In fact, we think there are others in the drug supply chain who may have made the “evolutionary leap” with these kind of drug reference pricing games before PBM private label products. We’ll try to review them quickly in our already lengthy analysis today.
Evolutionary ancestors: Wholesaler-owned private labels
Before vertical PBM companies launched private label products, other companies had already etched their place in the annals of history. As a matter of fact, we have federal definitions of private label distribution and distributor because of the actions of companies before PBM-private label products existed. We also have a technical distinction between private label activities from those of repacking activities related to prescription drugs (again, also because of the actions of companies that pre-date PBM private label products). In other words, PBMs aren’t the first companies to play in the private-label gene pool, so let’s look at what other members of the supply chain who have private label products might teach us.
The three largest prescription drug wholesalers in the United States are McKesson, Cencora, and Cardinal Health. At least two of the three have their own private label catalogs and private label catalogs that pre-date PBM these activities. For the unfamiliar, the following links each wholesaler with their known private label catalog (maybe Cardinal Health has one and we’re just unaware):
McKesson has NorthStar and Aisling
Cencora has Blue Point
What this means is that we can compare the pricing dynamics of these wholesaler private label products, which came before PBM private labels (and therefore may have influenced PBMs’ own strategies with their affiliated private label offerings) and make comparisons between their pricing behavior and Quallent. For the sake of this analysis, we’re not going to recreate all the AWP and WAC charts for each wholesaler private labels on all the Quallent-equivalent products. Rather, we’re just going to add their AWP-to-WAC ratios to the earlier Quallent bar chart (Figure 8). Again, we’re taking this short cut because the AWP-to-WAC ratio is perhaps the most interesting as it speaks to the disconnect between the price that might be anticipated to be incurred to put the product on the shelf (WAC) and the price that might be anticipated to be reimbursed when selling the product off that same shelf (i.e., AWP). When we do so, you can see that while Quallent does seem to be at the high-end of these ratios; only not the case in about a third of all the comparisons that can be made in the overlapping product portfolios of Quallent, McKesson and/or Cencora.
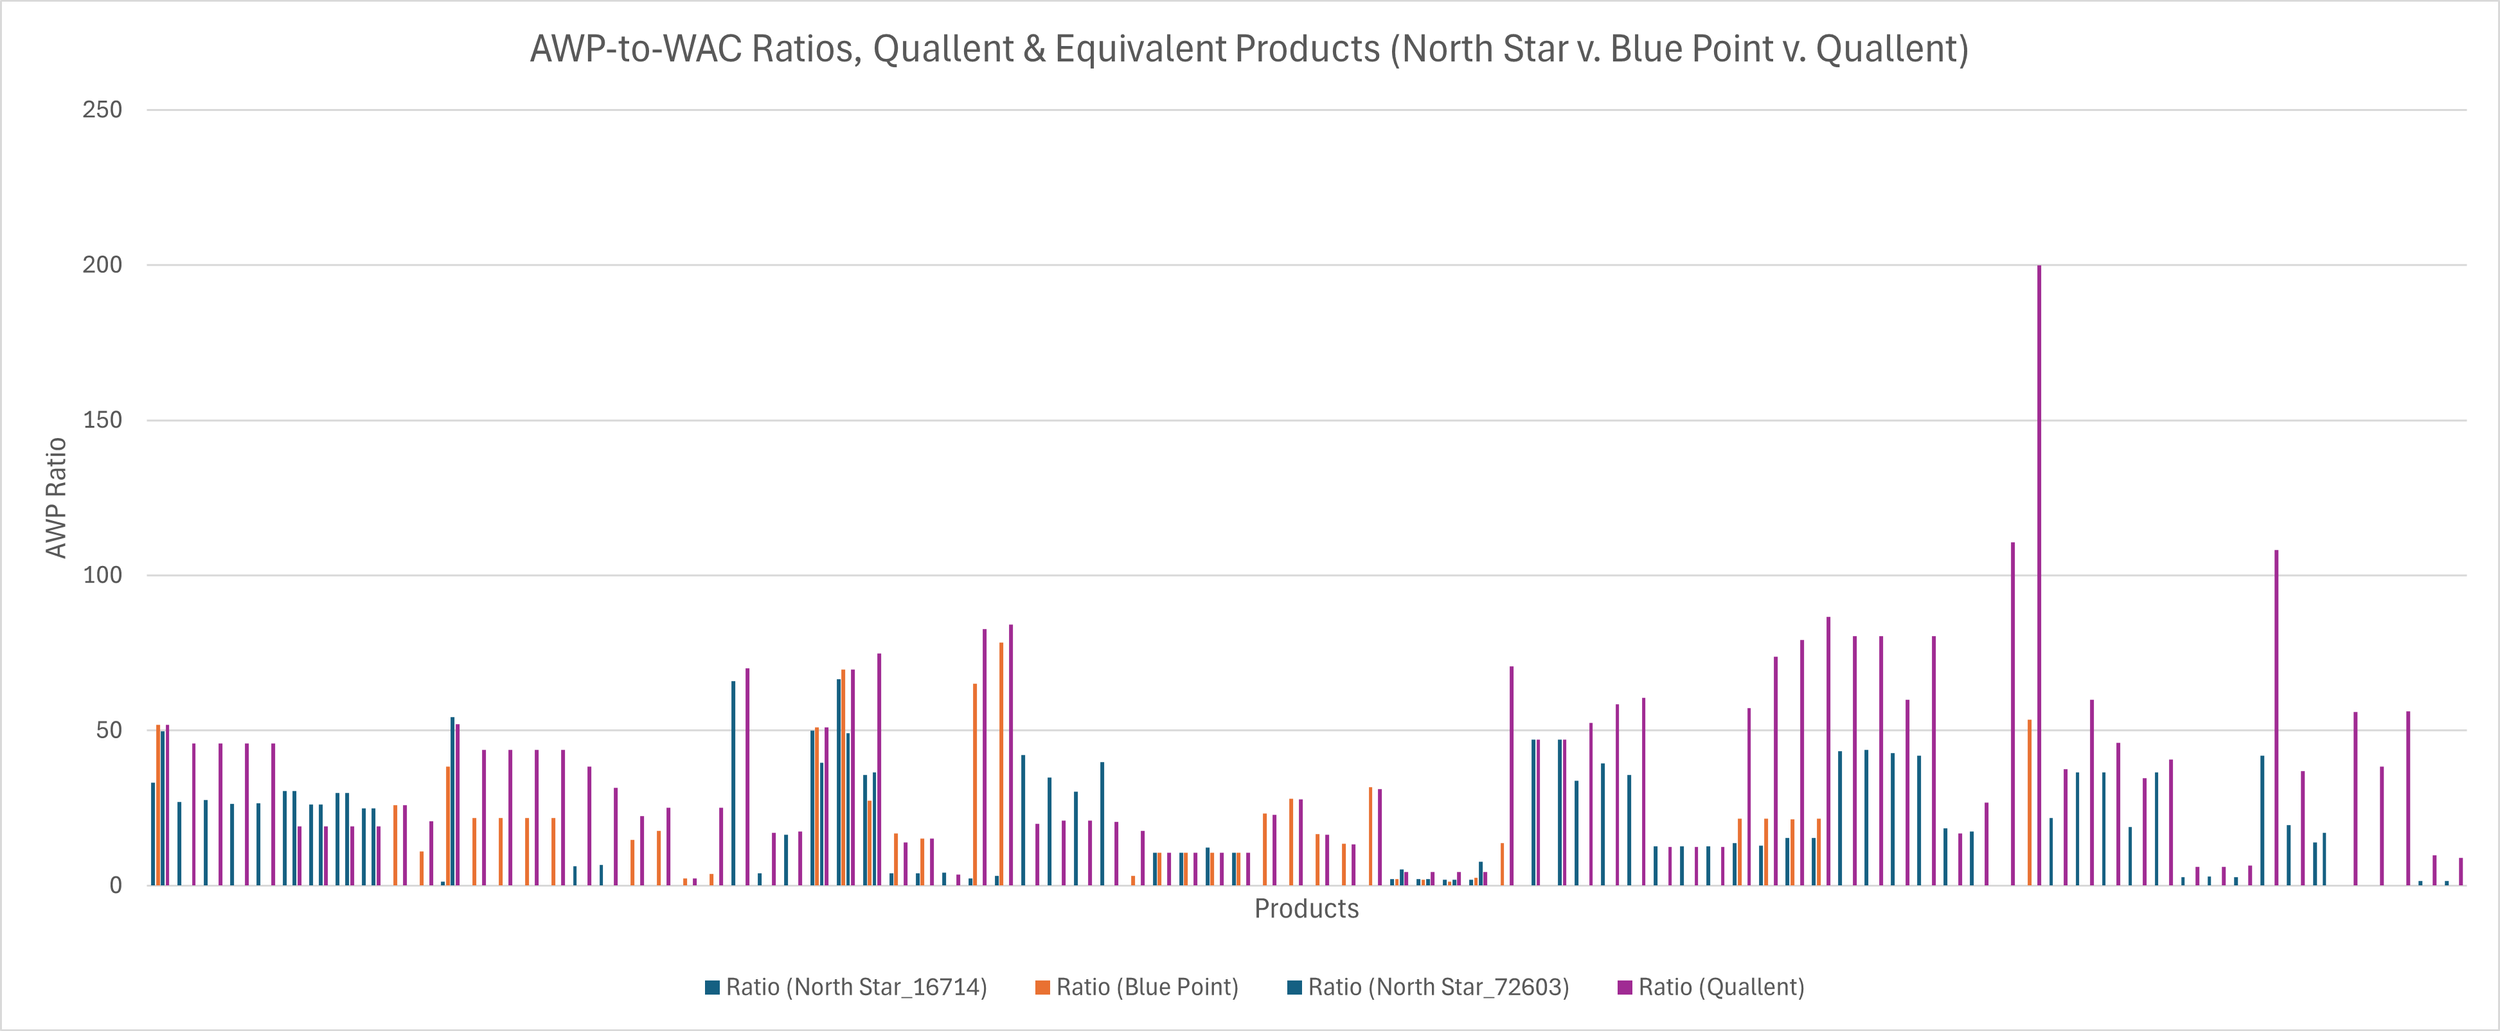
Figure 8
Source: Elsevier’s Gold Standard Drug Database
What does this ultimately tell us? Well, to start, probably that we need to spend some more time exploring some of these wholesaler behaviors, but that is probably a story for another day. As it relates to what we’re discussing today, on its surface it demonstrates the PBMs are not the only ones that understand the importance of AWP price points. As PBMs adapt their business model to the ever-changing healthcare landscape, it stands to reason they’d look to see what has worked for others. McKesson, for example, is company #9 and Cencora is #10 on Fortune’s 500 list, which we suspect may mean PBMs monitor their behavior as part of their everyday business (and potentially model or adapt some of their programs and initiatives based upon what they’ve encountered working with and alongside these wholesalers). Even if PBM’s don’t, Figure 8 demonstrates that PBMs are not the only ones who this report could have been about; except we’re not aware of the wholesalers telling us they’re the only one working to lower prices (which I guess, in fairness, Quallent’s WACs are low so kudos there)
AWP vs. NADAC pricing trends: “But you didn’t ask for reality. You asked for more teeth.”
Before we wrap things up, we feel remiss to not at least bring some NADAC learnings into this discussion. By definition, NADAC is a pricing benchmark outside of manufacturer list price control. A manufacturer sets their sticker prices, but invoice price observations between pharmacy purchases from wholesalers ultimately determine the NADAC value. And if a wholesaler is doing something potentially weird, or out-of-the-norm things with their pricing, then NADAC will essentially smooth that out, as it serves as a kind of MAC list for generic prices (an average of the submitted pharmacy acquisition costs, meaning some highs and lows will occur therein). Objectively, if you look at the 124 products that make up this analysis (the Quallent catalog), on an AWP-basis, the underlying NDCs have seen effectively no price movement over time. If we take each product and look at the original published AWP price point to its current one (at least within what Elsevier offers), what we see is that AWPs don’t really ever change, and if they do change, they tend to increase more than they decrease.
AWP Price Change Behavior, Quallent & Equivalent Products
Alternatively, if we look at the NADAC price points for these same products, comparing the first NADAC price to the current NADAC price, what we see is the exact opposite. Almost every price has decreased over time.
NADAC Price Change Behavior, Quallent & Equivalent Products
And although these products are launching and coming to market at different times, the average NADAC change experience from their respective starting points (which we recognize is a bunch of different starting points) to current is a decline in NADAC price of 58% (all end prices were pulled at start of July 2025). To be clear, the average time from a product’s first NADAC price to its current NADAC price across these products is 3,878 days (or around 10 years). So these products have, in general, been around for a long time and have seen a great deal of variability in their NADAC prices over that time. Now if you don’t like pricing volatility (i.e. a responsive marketplace) and if you don’t like drug prices going down, we can see how AWP would be an appealing benchmark, but we’re not sure that is what anyone actually says they want drug prices to do.
So to put a bow on this NADAC vs AWP analysis, the main takeaways are the following: The sticker prices for these medicines in general never change, and if they do, they increase more often than they decrease over time. Alternatively, the price of the medication as bought over time seems to be getting cheaper (if you know about NADAC pricing anyway).
It’s a dino-eat-dino world out there. Be at the table; not on the menu.
Perhaps more interesting, and more relevant to Adam Fein’s query that started us down this pathway, is why we are observing the pricing behavior in these data. No one forces a drug manufacturer to set an AWP price point. It is actually optional. In fact, many brands that come to market anymore do not directly establish an AWP. Rather, editorial policies of the prominent drug pricing compendia (Medi-Span, First Databank, etc.) will set an AWP for products that do not publish them (at the 1.2-multiple of the WAC; see example policy here).
Mark Cuban ran into this when they initially launched their albendazole product. Despite setting the lowest WAC price available at the time, we understand that they did not get very many typical drug channel customers for their albendazole product. We now can understand that this likely occurred because if you’re a pharmacy locked into an AWP-based payment contract (which, to be clear, isn’t always the way pharmacy is paid), then you cannot afford to buy a product that is going to be reimbursed to you at AWP-80%+ if the gap between your purchase price and the sale price isn’t sufficiently high enough to cover this gap. Again, we note that the incentives of the current ecosystem seem to favor high prices, not low (which may explain why Cuban often has to work outside prevailing health insurance company models to drive savings to the end payer).
Ultimately, what we find most interesting about this analysis is trying to understand what drove Quallent to its AWP-price point decisions. We observe that Quallent doesn’t appear to have a standard approach to the setting and maintenance of their drug prices. We say this because there is no standard ratio between their products’ AWPs and their underlying WACs (see Figure 7 earlier). If they had simply not set an AWP price point, the editorial policies of the system would have set one fixed ratio for them, for their products. But that is not what we observe. In fact, we don’t observe any obvious one policy to their pricing (as ratios go from the 1.2 up to over 200x; again Figure 7). This would seem to speak to some strategy here, but not one that seems obviously aligned with “low prices" (at least outside of WAC, which isn’t the price point that generally matters to the end payer). We also see at least some real-world evidence for what the reality may have looked like if they had adopted low-AWP prices (at least with imatinib as our judge and their AWP-to-WAC ratio vs. that of one of their competitors). As a manufacturer, they have control over both price points, and yet they are set in perhaps unexpected ways (if the goal is to work towards lowering drug prices, right?). How many PBM customers have contracts that pay on an AWP basis vs. how many have contracts that pay on WAC basis? If we look at financial statements of these companies, they tell us they understand the importance of drug reference prices. While this is not financial advice, we encourage you to look at the 10-K statements of the PBM parent companies. You’ll find guidance to their investors or potential investors that looks something like what the Cigna Group’s says in Figure 9:

Figure 9
Source: The Cigna Group
And if you go back in time, you’ll see that as recently as 2019, the guidance was more explicit. The 10-K back then for the same group (depending upon your Ship of Theseus feelings on sameness of group post acquisitions) mentions AWP pricing by name, essentially disclosing that if AWP goes away, it could have a material adverse effect on their business and results of their operations (Figure 10):

Figure 10
Source: The Cigna Group
Look, it is admirable that companies like Express Scripts, CVS, and Optum say they are working towards cost-plus models. CVS specifically has highlighted the pitfalls of the market basket pricing that has been borne out of AWP-based models. However, those legacy PBM efforts seem to be worth a little more scrutiny as the PBMs also become drug companies. After all, it was the PBMs that told us that manufacturers need to lower their list prices. And yet, now that PBMs and their parent companies are donning the robes of the drug manufacturer, the Quallent generic data points and the broader PBM private label biosimilar offerings do not appear to be following their own advice (or at least not fully given AWP and WAC disconnects). In a world where PBMs traditionally anchor pricing guarantees for plan sponsors to AWP, and the AWPs set by the PBM’s affiliated drug labeler are not just routinely above the norm, but in fact are way above the norm, how are we honestly supposed to assess the integrity of their claims to desire low prices when they are so obviously setting high ones?
And building on this theme, if PBMs do in fact forgo their legacy AWP pricing models in favor of cost-plus pricing, if they get to subjectively define what cost is, then are we really making any real progress here? If PBMs are using AWP-based models as a profit-generation tool instead of a fiduciary-like endeavor to maximize savings for payers, then why should we expect anything materially different from the same companies’ cost-plus models moving forward? Just because you set a low ingredient cost doesn’t mean that the cost of the dispensing fee, shipping fee, administrative fee or others fees that may drive a cost-plus pricing future are fair and reasonable. As publicly-traded companies with fiduciary obligations to shareholders and histories of making old money with new logistics in the face of public scrutiny, why shouldn’t we be looking at these latest contortions as the just another long journey back to the starting line?
Which, in turn means, we think we ultimately need to recognize that these harsh realities may be more of a function of the drug pricing environment we find ourselves in: an environment that does not set financial rewards for making us healthier, but rather sets financial rewards for those who are best able to control the information about what a drug’s price is. This begs the question, is the environment actually hostile to lower drug prices such that adaptive responses that seek to lower them (be they Mark Cuban, Civica, or others) doomed to evolutionary failure?
Our collective actions in what we decide we want drug pricing to do and accomplish will ultimately be the judge of that.