
What’s happening to generic drug prices? November 2019 NADAC Survey Update
Hi there again, drug pricing maestros. CMS once again recently released their latest NADAC survey results, which means it’s time to check in on the latest generic drug price changes.
There was a lot of movement on drug prices last month, so be sure to click through our new updated visualizations (NADAC Change Packed Bubble Chart and Drug Pricing Dashboard) to see the impact.
As a reminder, each month, retail community pharmacies across the country are surveyed by Myers Stauffer (on behalf of the Centers for Medicare and Medicaid Services) on their wholesaler invoice prices. The results are then compiled and released either the third or fourth week of the following month. On November 20th, survey results were released that reflect National Average Drug Acquisition Cost (NADAC) price changes from October.
Here are our top takeaways on last month’s results:
1. Unweighted price changes paint a favorable deflationary picture
Each month, we first look at how many generic drugs went up and down in the latest month’s survey of retail pharmacy acquisition costs, and compare that to the prior month. As shown in Figure 1, November was a better showing than October, at least if you are a fan of (unweighted) generic drug deflation.
Basically, the quick way to read the chart below is to look for blue bars that are taller than orange bars to the left of the dotted line and exactly the opposite to the right of the dotted line. That indicates a good month – more generic drugs went down in price compared to the prior month, and less went up.
And that’s exactly what happened in November.
Figure 1
Source: Data.Medicaid.gov, 46brooklyn Research
To put some numbers to this, for every generic drug that experienced a price decline this month, there were 0.86 generic drugs that experienced a price increase. That’s down considerably from a ratio of 1.12 last month.
In October, there were 11% more generic drugs that experienced a 0-10% price decrease and 6% more generic drugs that experienced a price decrease of more than 10%. Also, there were 14% fewer drugs that experienced a 0-10% price increase, and 20% more drugs that experienced a price increase of more than 10%.
All good news.
2. Only $11 million in weighted Medicaid deflation
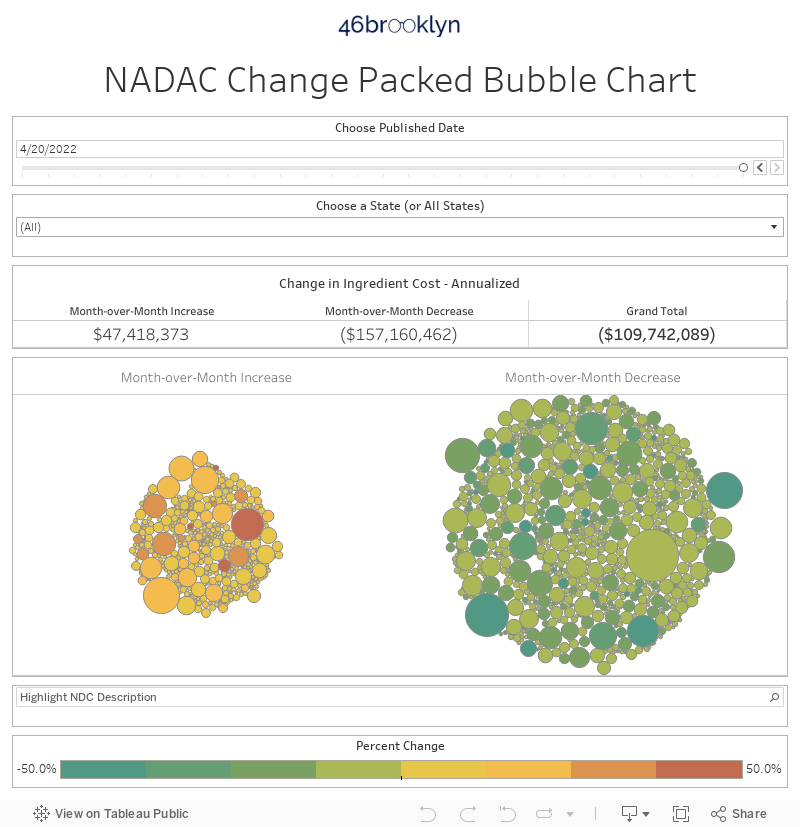
As we’ve written in prior updates, knowing the price change alone is not enough. We need to apply utilization (drug mix) to the price changes, which is the purpose of the NADAC Change Packed Bubble Chart (embedded below). We use Medicaid’s Q3 2018 through Q2 2019 drug mix to arrive at an estimate of the total dollar impact of the latest NADAC pricing update. This helps quantify the real impact of those price changes from a payer’s perspective.
The green bubbles on the right of the below viz are the generic drugs that experienced a price decline in the latest survey, while the yellow/orange/red bubbles on the left are those drugs that experienced a price increase. The size of each bubble represents the dollar impact of the drug on Medicaid, based on utilization of the drug in the most recent trailing 12-month period. Stated differently, we simply multiply the latest survey price change by aggregate drug utilization in Medicaid over the past year. Add up all the bubbles, and we get the total inflation/deflation impact of the survey changes.
So while Figure 1 may make us feel pretty good about November price changes, there was a problem … this month’s “winners” (i.e. deflationary drugs) tended to be lower-utilization drugs than this month’s “losers.” Put it all together and the weighted impact to Medicaid of the latest monthly survey was only $11 million in deflation. On a base of well over $6 billion in annual Medicaid generic spend on oral solids, that ain’t much.
3. Year-over-year deflation sinks to a 2-year low of 8.5%
Trailing-twelve-month generic deflation broke to the downside in November, setting a fresh 24-month low of 8.5% this month.

Figure 2
Source: Data.Medicaid.gov, 46brooklyn Research
While this analysis tends to show fluctuation from month-to-month, it is clear that the last six months are showing atypical levels of under-performance. When we pointed this out in June, it caused a little stir, but we cautioned people from taking any big leaps from the one-month data sample. Here’s what we said at the time:
It is important to note that this is only one data point. It could be an errant data point – possibly reflective of a “paucity of new generic introductions?” Or it could be the early signs of the impact of generic manufacturer product rationalization after multiple years of double-digit deflation browbeating. Too early to tell… but one thing is certain – anyone interested in drug pricing should be keeping a close eye on this.
Well, we’ve been keeping an eye on it, and of the oral solid medications that have a NADAC value (which is an overwhelming majority), the last six months of data shows a disturbing trend of generic marketplace inefficiency.
We’ll keep tracking in our forthcoming NADAC updates, but for those of you holding your breath for a sharp and sustainable snap back to the days of mid-to-high teens generic deflation, well … you may want to get some tips from this guy.
By the way, if you’re curious about how we created the above chart, take a look at our June 2019 NADAC survey report for more detail on our methodology.
4. Prices spike on generic Malarone
The most recent survey showed that generic Malarone (atovaquone-proguanil 250-100 mg tablet) prices jumped by 20%. The NADAC spiked from $2.58 per tablet to $3.10 per tablet.
Figure 3
Source: Data.Medicaid.gov, 46brooklyn Research
As you can see in Figure 3, this isn’t the first recent price spike for generic Malarone. Back in August, the 62.5-25 mg strength had increased by $0.32 per tablet. While that version of generic Malarone hasn’t budged since then, this most recent increase of the 250-100 mg strength resulted in nearly $200,000 of annualized increased spending for state Medicaid programs.
5. Generic Myfortic takes a healthy drop
On the deflation side, popular immunosuppressant, generic Myfortic (mycophenolic acid DR 360 mg tablet) saw its price erode by 12.6% – dropping from $2.52 per tablet to $2.20 per tablet.
Figure 4
Source: Data.Medicaid.gov, 46brooklyn Research
This recent deflation resulted in more than $1.4 million of annualized deflation to state Medicaid programs. State payers can now use the yielded savings on a fishing trip or a dinner at Hooters.
6. Prices of generic Prograf show greater volatility
Last month, we showcased the price spikes of generic Prograf (tacrolimus). This month, we saw trends diverge a bit. The 0.5 mg and 1 mg strengths of tacrolimus dropped by $0.02 per capsule and $0.17 per capsule respectively. But the 5 mg strength of tacrolimus jumped by $1.03 per capsule.
Figure 5
Source: Data.Medicaid.gov, 46brooklyn Research
Between the changes in all three strengths of tacrolimus, it resulted in around $5 million in annualized deflation for state Medicaid programs. When combining both this month and last month, despite this month’s deflation, it nets out to more than $5.7 million in annualized inflation for state Medicaid programs.
What are you seeing?
While we spend more time than we’d like to admit studying the pricing changes during each NADAC Survey Results Week, we don’t always catch every story worth noting. Be sure to take a gander at all of our updated Visualizations that rely on NADAC prices. If you’re seeing any interesting movement on drugs in the dataset, let us know.