
What’s happening to generic drug prices? October 2019 NADAC Survey Update
Hi there again, drug pricing cognoscentes. Wonderful news! CMS recently released their latest NADAC survey results, which means it’s time to check in on the October generic drug price changes.
There was a lot of movement on drug prices last month, so be sure to click through our new updated visualizations (NADAC Change Packed Bubble Chart and Drug Pricing Dashboard) to see the impact.
As a reminder, each month, retail community pharmacies across the country are surveyed by Myers Stauffer (on behalf of the Centers for Medicare and Medicaid Services) on their wholesaler invoice prices. The results are then compiled and released either the third or fourth week of the following month. On October 23rd, survey results were released that reflect National Average Drug Acquisition Cost (NADAC) price changes from September.
This report contains a lot of notable pricing movement on drugs that have been frequent flyers in previous 46brooklyn reports, giving long-time readers a nice stroll down memory lane. Here are our top takeaways on last month’s results:
1. October unweighted price change histogram degrades
Each month, we first look at how many generic drugs went up and down in the latest month’s survey of retail pharmacy acquisition costs, and compare that to the prior month. As shown in Figure 1, October wasn’t so pretty relative to September. Basically, the quick way to read the chart below is to look for blue bars that are taller than orange bars to the left of the dotted line and exactly the opposite to the right of the dotted line. That indicates a good month - more generic drugs went down in price compared to the prior month, and less went up.
Unfortunately, the opposite happened in October. Blue bars are smaller than orange bars to the left of the line and bigger to the right of the line. Oh fiddlesticks.
Figure 1
Source: Data.Medicaid.gov, 46brooklyn Research
To put some numbers to this, for every generic drug that experienced a price decline this month, there were 1.12 generic drugs that experienced a price increase. That’s up considerably from a ratio of 0.83 last month.
In October, there were 16% fewer generic drugs that experienced a 0-10% price decrease and 7% fewer generic drugs that experienced a price decrease of more than 10%. Also, there were 16% more drugs that experienced a 0-10% price increase, and 15% more drugs that experienced a price increase of more than 10%.
Surely, this poor showing in the “unweighted price change” category must mean that there was drug price inflation in October using Medicaid’s drug mix. Right?
2. Wrong! This month brought $56 million of annualized deflation using Medicaid’s drug mix
As we’ve written in prior updates, knowing the price change alone is not enough. We need to apply utilization (drug mix) to the price changes, which is the purpose of the NADAC Change Packed Bubble Chart (embedded below). We use Medicaid’s 2018 drug mix to arrive at an estimate of the total dollar impact of the latest NADAC pricing update. This helps quantify the real impact of those price changes from a payer’s perspective.
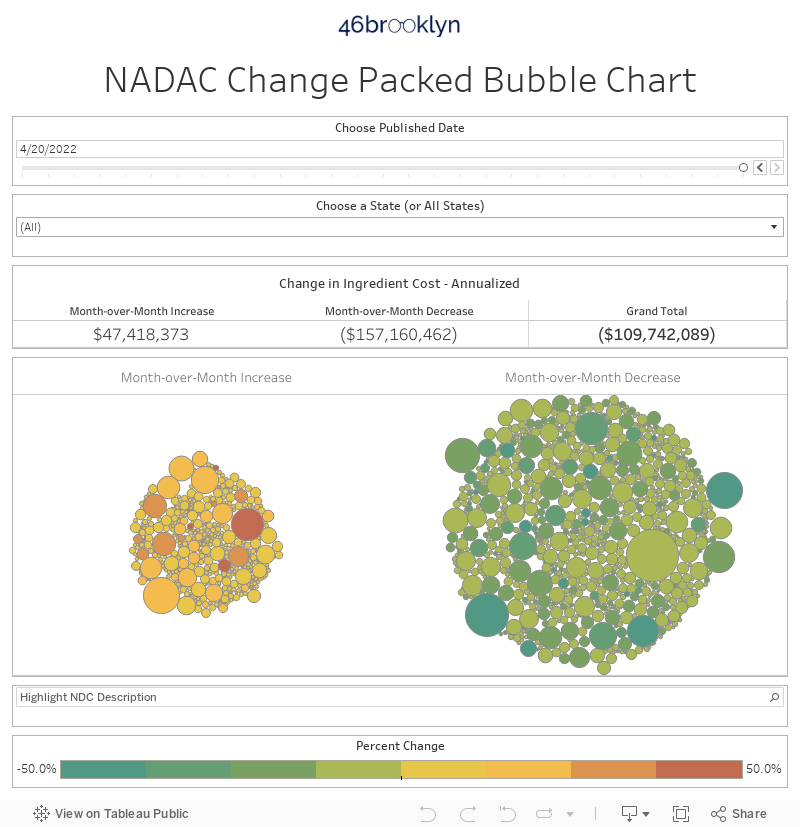
The green bubbles on the right are the generic drugs that experienced a price decline in the latest survey, while the yellow/orange/red bubbles on the left are those drugs that experienced a price increase. The size of each bubble represents the annualized weighted impact of the drug on Medicaid – i.e. we multiply the survey price change by aggregate drug utilization in Medicaid. Add up all the bubbles and we get the total annualized inflation/deflation. As you can see some of the heavy utilization hitters in Medicaid experienced sizable price decreases this month, more than offsetting the fact that there are more drugs on the unfavorable side of the ledger. Add it all up and you get $56 million in annualized deflation.
3. Year-over-year deflation inches down to 11.6%
Trailing-twelve-month generic deflation was 11.6% this month, down ever so slightly from 11.8% last month.
As shown in Figure 2, we have yet another data point suggesting generic deflation is resetting in a new, lower range.
Is it? Is it not? Tune in next month! Same bat-time. Same bat-channel.

Figure 2
Source: Data.Medicaid.gov, 46brooklyn Research
By the way, if you’re curious about how we created the above chart, take a look at our June 2019 NADAC survey report for more detail on our methodology.
4. Generic Gleevec prices continue to drop
The drug that started it all for 46brooklyn is back. For those uninitiated, if there’s one drug that we have studied the most since our launch in 2018, it is the popular (and expensive) leukemia treatment, generic Gleevec (imatinib mesylate 400 mg Tablets). It was the focus of our first drug pricing report, and it has been a staple in our work ever since. Before we get to this month’s pricing movement, here’s a quick rundown of our coverage since that first report:
September 13, 2018: Bloomberg digs into prescription drug markups on drugs like generic Gleevec
September 20, 2018: NADAC review shows generic Gleevec trickling down to $21 per tablet
October 30, 2018: New dashboard shows generic Gleevec markups rising
December 5, 2018: Big markups on generic Gleevec highlighted in Pennsylvania
January 25, 2019: Generic Gleevec dips to under $14 per tablet
April 23, 2019: The Columbus Dispatch reports on the new 46brooklyn findings
April 30, 2019: Ohio Medicaid officials announce plans to reform specialty drug policies
July 26, 2019: Generic Gleevec acquisition cost falls below $13 per pill
While some might argue that going through this entire 46brooklyn generic Gleevec catalog might be less satisfying than an hour-long YouTube journey through 1990s professional wrestling stars, just in case you don’t read through it all, here’s the short of it:
Generic Gleevec hit the market in 2016 at a slight discount to the expensive brand version that it sought to copy. At that time, it was more than $300 per pill. Since then, the drug has deflated significantly, but as the price eroded, government payers in Medicaid and Medicare Part D weren’t seeing the savings. The markups have resulted in overcharges of thousands of dollars per prescription.
Well, we’ve got more salt in the wound for payers who have PBMs that price drugs based on stale, artificially-inflated benchmarks. This month saw the price of generic Gleevec take another dive. down to just $7.56 per tablet.
Figure 3
Source: Data.Medicaid.gov, 46brooklyn Research
5. Generic Glumetza prices step down again
While generic Gleevec has always been the apple of our eye, a drug that has experienced similar massive drug supply chain pricing distortions is generic Glumetza (metformin ER 1,000 mg Gastr-TB).
We had highlighted how generic Glumetza saw a hefty 15.9% NADAC price increase back in our April report, but since then, the price has continued to trend downwards, with this most recent decrease shaving 17.1% off of last month’s price.
Figure 4
Source: Data.Medicaid.gov, 46brooklyn Research
In that April report, we also highlighted some of the massive markups that state Medicaid managed care programs were paying on the drug as well. Those hefty markups are a big problem for patients and payers who have faced struggles affording the treatment.
In May, we questioned some of the formulary management decisions that paid for this drug that at the time carried a NADAC of $2,200 per generic Glumetza prescription, at the same time that regular, old Metformin sported a NADAC of $4.48 prescription.
So, despite the drug dropping in price by $2.35 per tablet, much like generic Gleevec, it appears that many state payers will not see the benefits of those eligible savings.
6. Prices bounce on generic Prograf
While the two previous high-markup drugs saw price declines this past month, another high-markup drug popped off the page in our bubble chart, except this one actually spiked in price. That drug was generic Prograf (tacrolimus 1 mg and 5 mg strengths).
Back in April, we posited that generic Prograf was a drug that was being exploited by big pharmacy benefit managers (PBMS) for spread pricing, which explained some of the massive markups that we had been seeing in Medicaid managed care programs. A report released that same month by 46brooklyn’s co-founders (through their consultancy 3 Axis Advisors) also showcased that Tacrolimus was being targeted for PBM spread within the Michigan Medicaid managed care program. We had further validation of our suspicions in our May CMS state utilization data report.
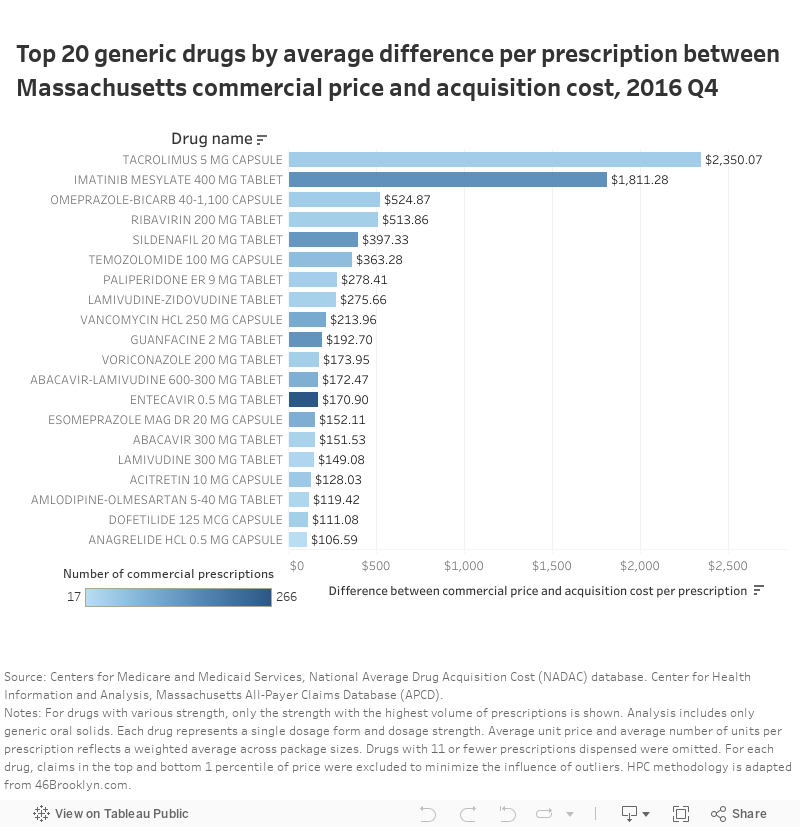
In June, the Massachusetts Health Policy Commission released a big report entitled, “Cracking Open the Black Box of Pharmacy Benefit Managers,” that highlighted prescription drug markups in their state, but instead of only focusing on Medicaid, they also had data from commercial payers as well. Unsurprisingly, it also appeared that while the price of Tacrolimus was going down, PBMs used the deflating price as an opportunity to increase their charges back to commercial payers. Below is a visualization from the Massachusetts HPC report. As you can see, for commercial payers in Massachusetts, Tacrolimus 5 mg had the highest PBM markup out of any generic drug in the market.
As mentioned above, whereas generic Gleevec and generic Glumetza went down in price, generic Prograf (tacrolimus) went up in price. Specifically, the 5 mg strength increased by 15.3% – jumping from $1.86 per capsule to $2.15 per capsule. Meanwhile, the 1 mg strength more than doubled in price – moving from $0.23 per capsule to $0.49 per capsule.
Figure 5
Source: Data.Medicaid.gov, 46brooklyn Research
These increases added more than $10.5 million in annualized ingredient cost to state Medicaid programs.
But perhaps even worse, our research has shown that after a generic drug price spike, it often becomes a new opportunity for the supply chain to make new, elongated markups on old, cheaper medications. For more on that dynamic, read our deep dive into Hydroxychloroquine. Long story short; even small generic price increases can have long-term cost implications for payers.
7. Major increases on generic Xeloda
Again, another drug that we could be accused of being quasi-obsessed with is generic Xeloda (capecitabine 500 mg Tablet). It’s also been plagued by massive markups in the research we’ve conducted.
We first noticed back in October 2018 that generic Xeloda had some of the biggest overcharges in the nation. We found big markups on it in Pennsylvania back in December 2018. In April 2019, we had identified it as exhibiting similar supply chain pricing patterns as generic Gleevec, meaning that it appeared to be a big target for PBM spread. And in July, we noted that the price had dropped 27% that month.
This month however, generic Xeloda jumped back up by more than 50% – a total boost of $1.24 per tablet. This price increase is the largest one since May 2017, and it results in more than $3 million in annualized ingredient cost increases to state Medicaid programs.
Figure 6
Source: Data.Medicaid.gov, 46brooklyn Research
What are you seeing?
While we spend more time than we’d like to admit studying the pricing changes during each NADAC Survey Results Week, we don’t always catch every story worth noting. Be sure to take a gander at all of our updated Visualizations that rely on NADAC prices. If you’re seeing any interesting movement on drugs in the dataset, let us know.
Thanks to Shen Wu Tan at the Washington Times for mentioning last month’s 46brooklyn report on generic drug launch prices. Additional thanks to Jennifer Reck and Trish Riley at the National Academy for State Health Policy (NASHP) for highlighting the report as well.
Additional thanks to the American Society of Consultant Pharmacists, who is hosting 46brooklyn’s Eric Pachman at their Annual Meeting in Grapevine, Texas today.