
A return to some drug pricing normalcy
March 2021 monthly drug pricing review
Our long time readers will likely notice that this monthly drug pricing update is coming a little bit later than usual. That is not by accident, but rather a deliberate change we’re making so we can more holistically look at U.S. drug prices by including both brands and generic medications within our monthly summary. From this point forward, these monthly reviews will examine the previous month’s drug price changes.
The CLIFF NOTES
On February 17, CMS published its latest update to the National Average Drug Acquisition Cost (NADAC) database. As a reminder, NADAC is the best national public database of surveyed pharmacy invoice costs to acquire prescription drugs. In other words, if you are looking to understand what pharmacies are paying to purchase drugs from their wholesalers each month (before rebates), and you don’t have tens of thousands of dollars buy this data, NADAC is where you must go.
As we’ve discussed at length over the years, NADAC is lagged by roughly two months. So the survey prices we just received in February reflect pharmacy invoice costs from December.
With regards to generic drugs, today’s key takeaway is our finding that this month’s NADAC price changes resulted in another $57 million in annualized generic drug deflation based on Medicaid’s drug utilization.
With regards to brand drugs, the 46brooklyn Brand Box score (which tracks changes in wholesale acquisition costs) reveals just 26 price increases in February (after deducting a few decreases), the second lowest number for the month of February over the last decade (and down from a high of 107 in February 2013). Interesting, but of course that says nothing about the changes in the net prices of these drugs. The good news on this front is the Congressional Busget Office (CBO) just chimed in on that in February, dropping the mic by disclosing Medicaid’s 77% rebates on brand-name drugs! At least one U.S. payer is getting net prices in line with other developed countries.
For those of you short on time, there are your cliff notes summary. More generic deflation. Large rebates on brands that further obfuscates true net pricing for payers. That’s about as normal as it gets for U.S. drug pricing.
For those of you interested in the details, here we go.
Brand Name Medications
1. Brand drug price changes worth taking note of in February
While most of the drug pricing focus in January was on brand price increases, we wanted to start this report by focusing on brand drug price decreases. The biggest price decrease in February belongs to a Pfizer drug… or Upjohn, or Viatris (hard to keep track of who own what nowadays with all of the mergers and acquisitions). Regardless, Pfizer / Upjohn / Viatris’ Depo-Provera (medroxyprogesterone acetate), a medication typically used to prevent pregnancy, saw a price decrease of 74% to 77.5%(depending upon formulation). While the impact of this price decrease will likely be small because Depo-Provera is a medication with a generic alternative (which is utilized far more frequently than the brand), it is worth giving credit to Pfizer for leading the brand drug pricing decreases in February, even if the impact of such a decrease is likely small. Interestingly, Pfizer also was unique among their peers when they lowered their prices on a slew of their medications last year as well.
On the list price hike side, the largest brand drug price increases in February were 9.9% and occurred across five different drugs (Lysodren, Unithroid, Farydak, Metopirone, and Dopram). These drugs are generally small volume drugs for cancer, rare breathing problems after surgery, or other less common disease states. All told, the current yearly median WAC price increase on a brand name drug is tracking at 4.9%, whereas the weighted average on drugs that are reporting a brand name price increase is 5.3%.
Overall, the most significant brand list price increase in February, as measured by total gross Medicaid dollars impacted, was Gamunex-C (immune globulin). Last year, before discounts, Medicaid spent a combined $84.7 million on Gamunex-C. At a 6.5% increase, total Medicaid expenditures could increase $5.1 million due to this price increase. Of course, the Medicaid Drug Rebate Program (MDRP) will likely negate the impact of this price increase to the Medicaid program, but that may not be the case for patients in high deductible health plans who will feel this price increase or for commercial payers who may not receive all available rebates for Gamunex-C.
2. CBO discloses the real cost of brand name drugs in public programs
Speaking of rebates, the Congressional Budget Office (CBO) recently released a report comparing brand-name drug prices amongst selected Federal Programs. It is a fantastic report that demonstrates not only how cheap some brand name medications can be after netting out rebates (as has been well documented) but also highlights the disparity in programs in recognizing the true net price of a drug. All programs in this CBO analysis roll up to the Federal government, many within the same agency [i.e. Health and Human Services (HHS) or Department of Defense (DoD)] and yet there is a great disparity in the net price realized on the drugs by these various programs.
Medicaid is able to recognize rebates on brand name medications up to 77% off their retail price (as shown from Table 2 in the report or Figure 1 below).

Figure 1
Source: Congressional Budget Office, February 2021
Other Federal programs, like Medicare, have the highest net prices. As shown in Figure 2 below, when CBO compared the average net price of top-selling brand-name drugs as a percentage of Medicare Part D prices in 2017, all other programs are coming in cheaper than Medicare (i.e. a lower percentage of the Medicare price). Some of them are just 20% cheaper – like the Department of Defense (DoD) TRICARE program. Others are ~50% cheaper, like the Department of Veterans Affairs (VA) Prime Vendor. Then there is Medicaid sitting at 65% cheaper. Different prices, same federal government. ¯\_(ツ)_/¯

Figure 2
Source: Congressional Budget Office, February 2021
To put this report into perspective for our commercial sector readers, let’s pretend that Medicaid is a large multi-national employer operating in the U.S. It is able to secure the best net price for the things it purchases, including prescription drug benefits. If Medicaid is the large, multi-national corporation with fancy lawyers, tremendous leverage, and the best benefits consultants, that would make:
The VA the large regional employer getting a slightly worse deal than Medicaid;
TRICARE the small mom and pop shop of maybe a dozen employees who is stuck paying close to full list prices for brand drugs; and
Medicare, which is perhaps the largest drug purchaser in the world (with purportedly the most “robust competition” amongst plan sponsors), essentially the cash-paying customer paying the most inflated prescription drug prices.
Welcome to the bizzaro world of prescription drug pricing where more “competition” drives prices up (see Elizabeth Rosenthal’s Rule #6 of her top 10 rules governing the dysfunctional American healthcare system).
The key takeaway from this report, in our opinion, is not that net prices for brand name drugs after rebate are low, rather it is that net prices are low if you’re in the right contract, have the biggest negotiating power, or have the power to write laws requiring drugmakers pay juicy rebates in order to gain access to your program.
While we all can look at the feds and roll our eyes at the seeming absurdities, let this be a friendly reminder of how inequities can spill out into the commercial and cash-pay marketplaces, as PBM price discrimination yields winners and losers by leaking large rebates (and associated fees) to some and miniscule ones to others.
As the CBO report demonstrates, if you’re not appropriately positioned – even within the Federal government – you could be paying 50% or even 75% more than you should despite being the largest purchaser. Said differently, if February taught us anything in the world of drug pricing, this CBO report reassures us that Medicare Part D is still messed up and in need of fixing (which is a return to normalcy for us at 46brooklyn).
Generic Medications
1. No change in month-over-month unweighted price changes
Each month, we look at how many generic drugs went up and down in the latest month’s survey of retail pharmacy acquisition costs (based on NADAC), and compare that to the prior month (Figure 3).
Basically, the quick way to read Figure 3 is to look for blue bars that are taller than orange bars to the left of the dotted line, and exactly the opposite to the right of the dotted line. That would indicate a good month – more generic drugs going down in price compared to the prior month, and less drug prices going up.
Figure 3
Source: Data.Medicaid.gov, 46brooklyn Research
In all the months we have been producing this chart, this is probably as close as we have come to the current month’s changes being almost identical to the prior month’s changes. Overall, a few more drugs decreased in price this month, offset by a few more increasing, largely resulting in an insignificant month-over-month change.
But as usual, take this unweighted price change analysis with a grain of salt. To really make heads or tails of all of these pricing changes, let’s weight these changes.
2. Weighted Medicaid generic deflation comes in at $57 million
The purpose of our NADAC Change Packed Bubble Chart (Figure 4) is to apply utilization (drug mix) to each month’s NADAC price changes to better assess the impact. We use Medicaid’s 2019 drug mix from CMS to arrive at an estimate of the total dollar impact of the latest NADAC pricing update. This helps quantify what should be the real impact of those price changes from a payer’s perspective (in our case Medicaid; individual results may vary).
The green bubbles on the right of the Bubble Chart viz (screenshot below in Figure 4) are the generic drugs that experienced a price decline (i.e. got cheaper) in the latest survey, while the yellow/orange/red bubbles on the left are those drugs that experienced a price increase. The size of each bubble represents the dollar impact of the drug on state Medicaid programs, based on utilization of the drugs in the most recent trailing 12-month period (i.e. bigger bubbles represent more spending). Stated differently, we simply multiply the latest survey price changes by aggregate drug utilization in Medicaid over the past year, add up all the bubbles, and get the total inflation/deflation impact of the survey changes.

Figure 4
Source: Data.Medicaid.gov, 46brooklyn Research
Overall, in January, there was $68 million worth of inflationary drugs, offset by $125 million of deflationary generic drugs, netting out to $57 million of deflation for Medicaid.
Before we dive into some of the specific drug details, we have one more top-down analysis to run – that is to investigate how generic drug prices are trending over time.
3. Year-over-year generic oral solid deflation shoots up to 18.6%
Ever since last June, we have been tracking year-over-year generic deflation for all generic drugs that have a NADAC price. We once again weight all price changes using Medicaid’s drug utilization data. Beginning in August 2019, we had been seeing a gradual compression in deflation (Figure 5). But oddly enough, as the pandemic started, this trend started to reverse, only starting to return over the last few months. This month, oral solid generic deflation shot up to 18.6% year-over-year (YoY), pushing well above the +1 standard deviation line. Deflation on all generics also increased meaningfully to 13.2%.
Figure 5
Source: Data.Medicaid.gov, 46brooklyn Research
4. ADHD meds are behind the spike in Medicaid’s YoY deflation this month
We promised ourselves we would not talk about ADHD meds again, a class of drugs which have been a constant fixture in these monthly pricing updates. But these drugs are such a large part of Medicaid’s mix, exhibit highly volatile pricing movements, and apparently just won’t stop deflating. So here we go again.
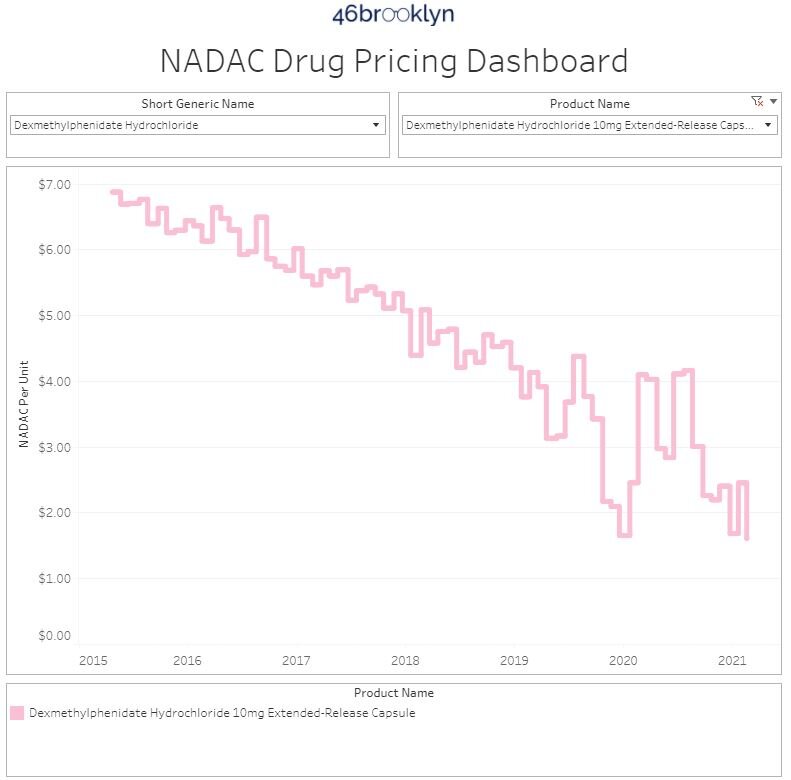
First, if you are wondering how YoY deflation can shoot up so much in a month where the month-over-month deflation was relatively modest, remember that Feb 2021 year-over-year (YoY) deflation takes into account the price this month compared to the price in Feb 2020. This gets a bit wacky for a drug like dexmethylphenidate 10 mg ER capsule (Focalin XR). Check out the whiplash in the NADAC of this drug in late-2019 / early-2020 (Figure 6). It fell from $4.37 per capsule in July 2019 to $1.65 per capsule in January 2021, before shooting back up to $4.09 per capsule in February 2021. Fast forward a year and the drug was around $2.50 per capsule at the end of January 2021 and $1.60 per capsule now. So when we calculated YoY deflation last month, there wasn’t any, whereas this month there was a ton. If this was a finance report, we would tell you that last month we “cycled a tough comp,”’ while this month we’re “cycling an easy comp.” Feel free to try using this phrase during a meeting. It will make the finance folks in your organization very nervous.
We realize that this example is super in the weeds, but we thought it was helpful to illustrate what’s going on behind the scenes of these high level aggregated deflation calculations.
Figure 6
Source: Data.Medicaid.gov, 46brooklyn Research
While this “easy comp” dynamic was a big driver of this month’s spike in deflation, other ADHD drugs contributed too. The chart below (Figure 7) shows the cost of extended release generic Adderall (30mg). It is currently just $0.71 per pill, down 57% from $1.65 per pill this time last year.
Figure 7
Source: Data.Medicaid.gov, 46brooklyn Research
Years ago, we lamented the sticky prices in ADHD medications, especially given how large a part of Medicaid’s drug mix these medications are. We couldn’t figure out why the prices wouldn’t decline as generics typically do. Well, it appears that Father Time has finally caught up to this class of medications, creating the potential for large cost savings in state Medicaid programs that directly see the benefit of deflation in actual drug costs through “cost-plus” reimbursement models.
This case study also highlights how important it is payers to know their drug mix, because which drugs are decreasing or increasing in price only matter if they’re drugs actually taken by people within your benefits program.
5. Stocking up on generic drug deflationary essentials
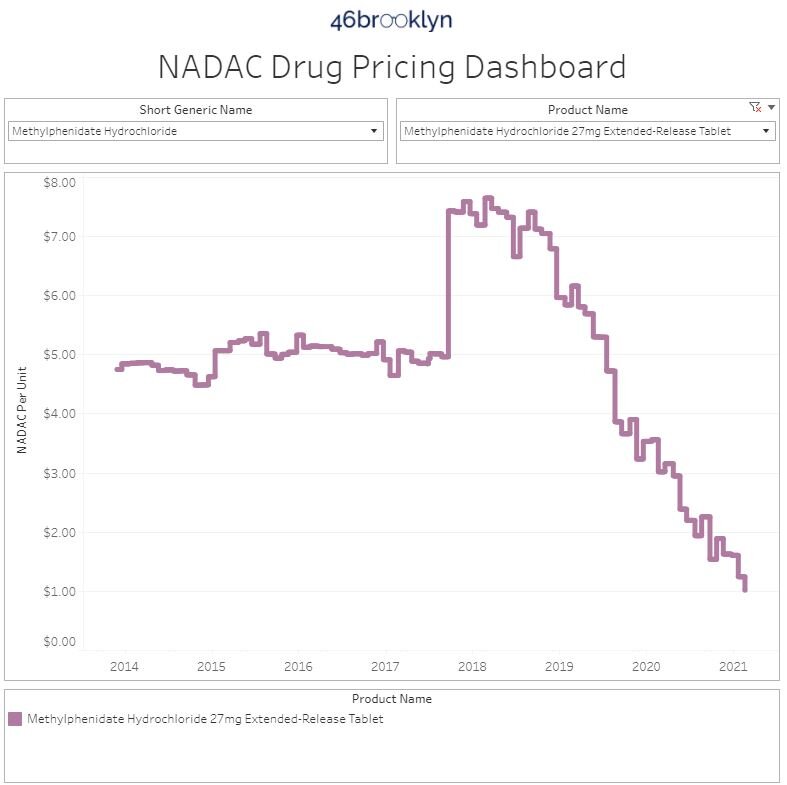
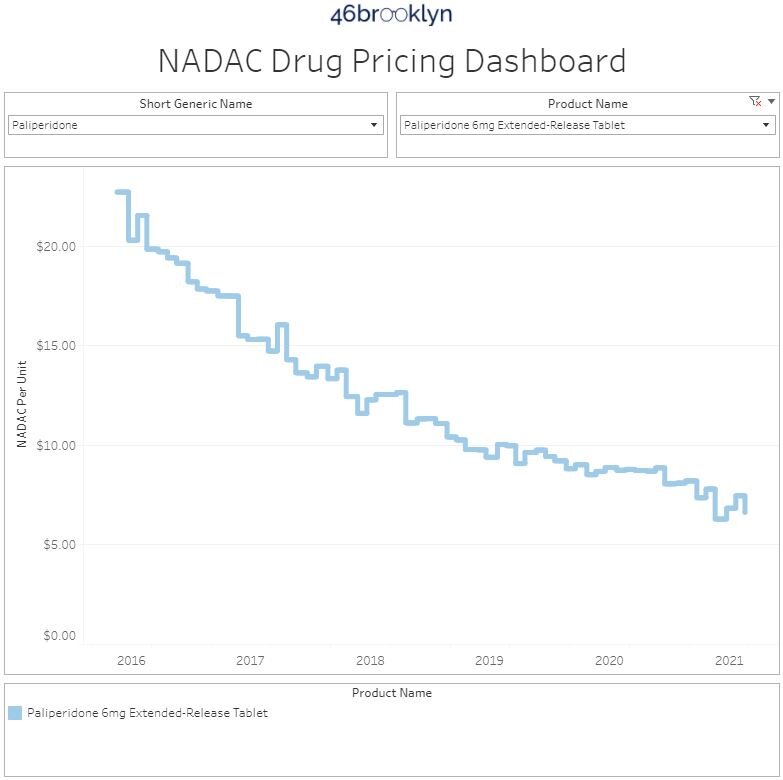
Now that we have gotten the aggregate picture out of the way, let us explore some of the more nuanced details. In this section, we provide a curated list (gallery of images below) of some of the more interesting generic drugs we see declining in price in this NADAC update and offer a brief commentary as to what we are seeing.
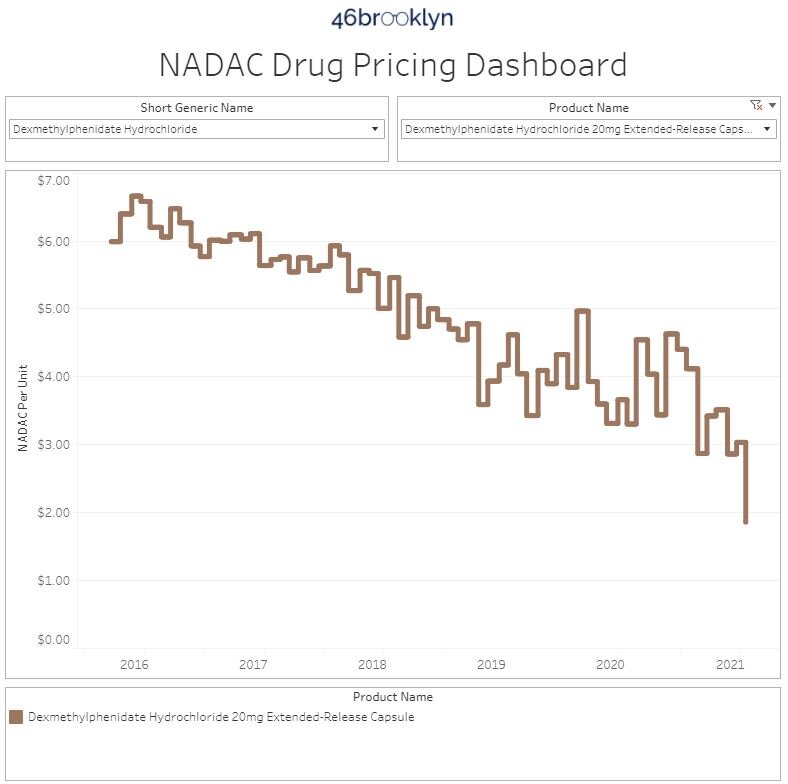
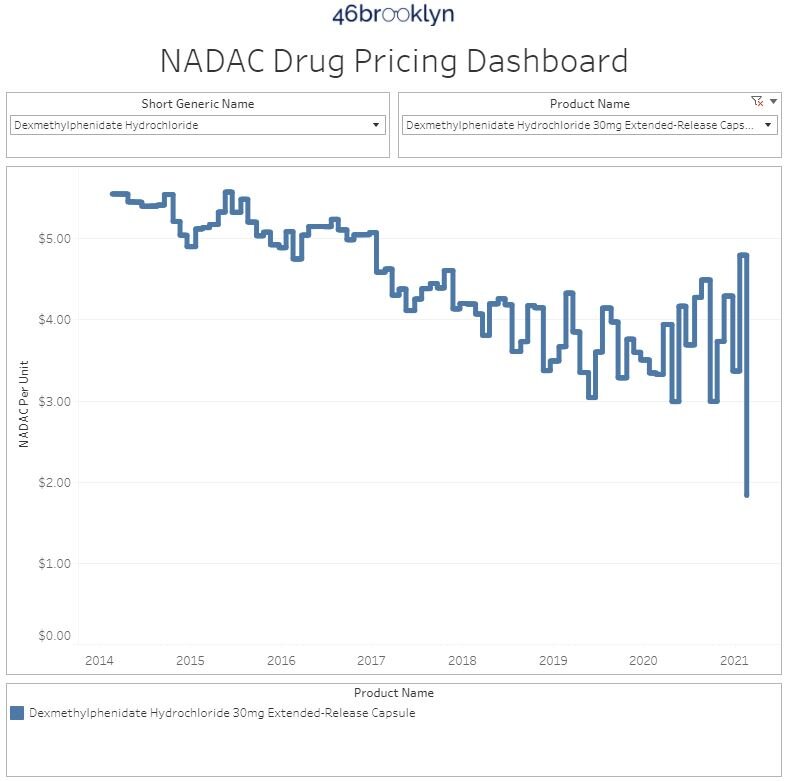
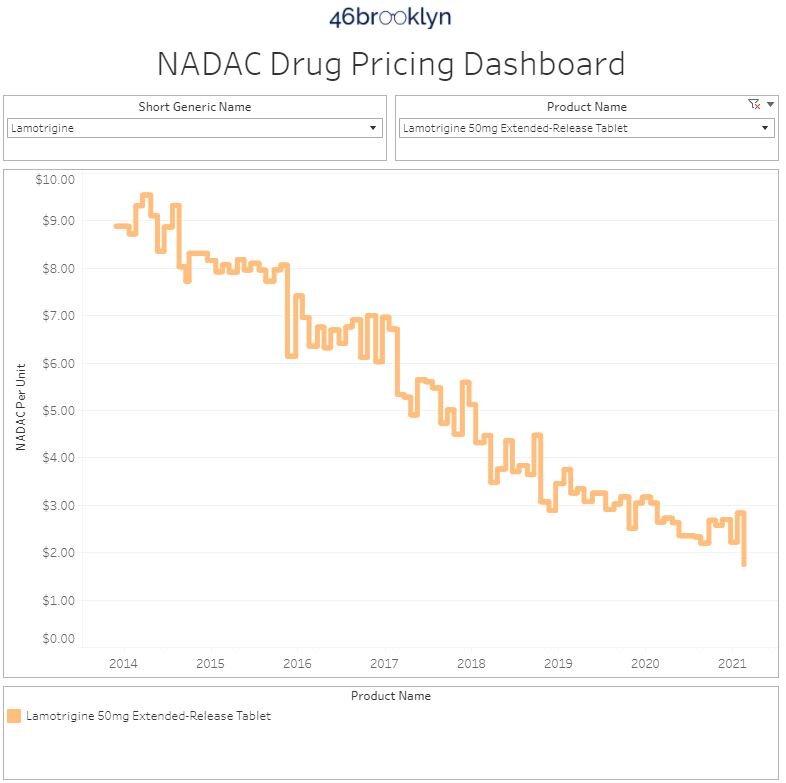
To start, here is the list of drugs, along with their typical use, that we are presenting in the gallery below. Note that each of these drugs experienced a price decrease, which when when sized using Medicaid’s utilization lowers annualized Medicaid expenditures by $1+ million each:
Dexmethylphenidate ER 10, 20, and 30 mg - to treat ADHD (already discussed, see Figure 6 above)
Methylphenidate ER 27 mg - to treat ADHD
Lamotrigine ER 50 mg - to treat seizures (was on the price increase watch list last month)
Paliperidone ER 6 mg - to treat schizophrenia
6. Keeping tabs on the generic drug increases
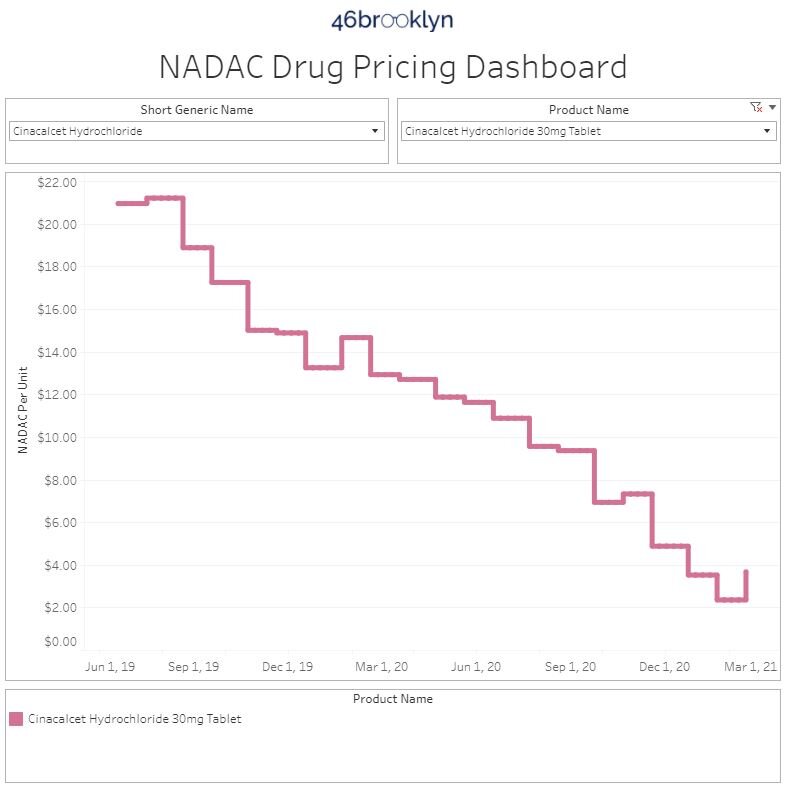
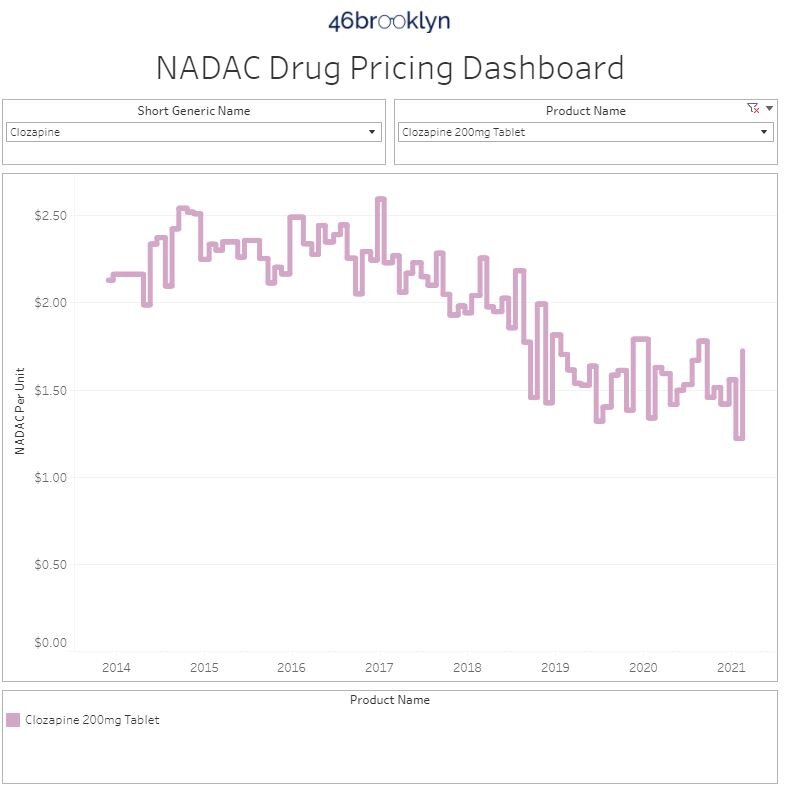
In keeping with our detailed view of drugs, this section provides a curated list (gallery of images below) of some of the more interesting generic drugs we see increasing in price in this NADAC report and offer a brief commentary as to what we are seeing.
The list of these drugs, along with their typical use, is below followed by the gallery:
Cinacalcet 30 mg - to treat low
Clozapine 200 mg - to treat schizophrenia
Dexmethylphenidate ER 25 mg - to treat ADHD
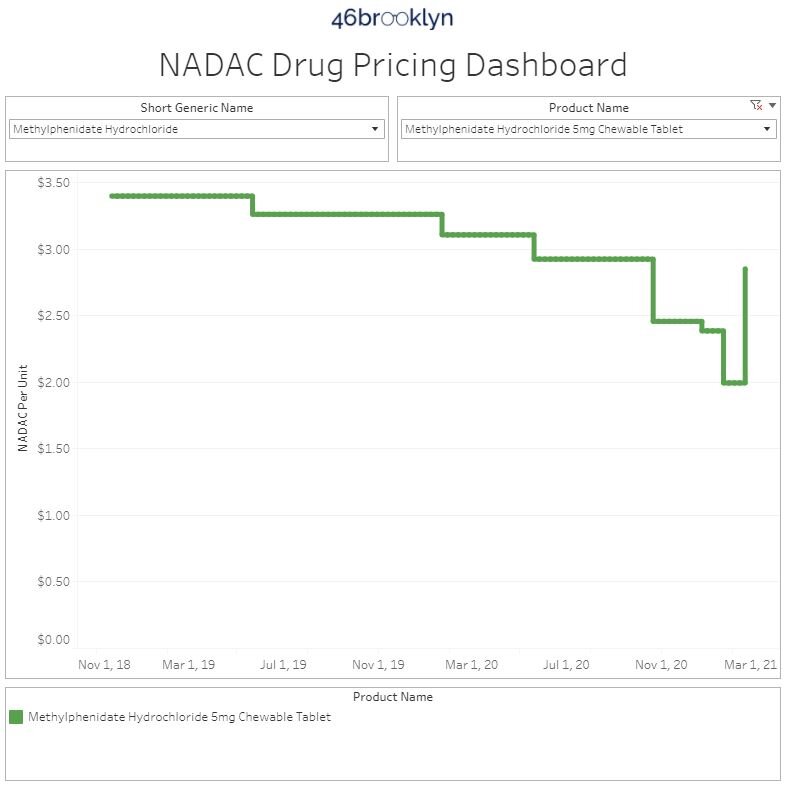
Methylphenidate 5 mg Chew - to treat ADHD
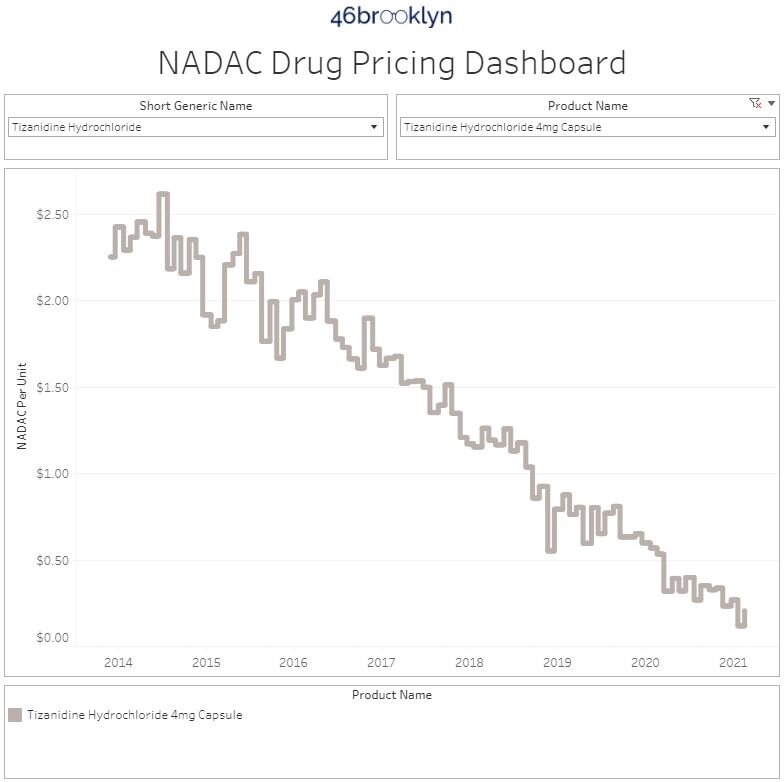
Tizanidine 4 mg capsules - to treat muscle spasms
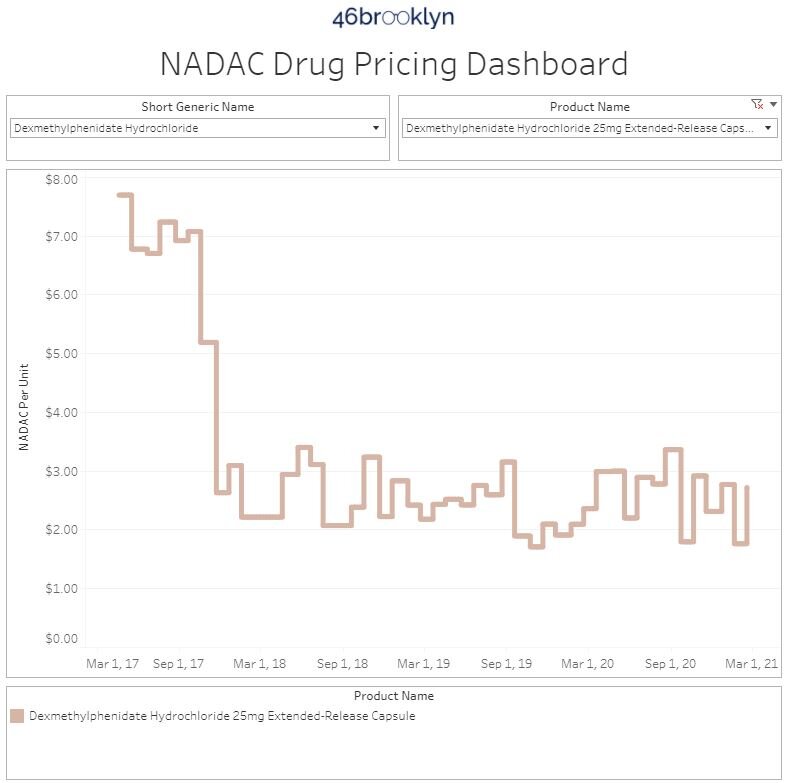
One of the things you will hopefully notice within our curated list is the overlap between some of the active ingredients in this list compared to the price decrease list. Dexmethylphenidate products, which we discussed in the prior section, were a key driver in generic drug price deflation in Medicaid, but at least one product saw a noticeable increase. It begs the question, do you really need exactly 25 mg of dexmethylphenidate or could you get away with 20 mg or even 30 mg if they were 20% cheaper? Oddball strengths, dosage forms, or re-formulations of cheaper alternatives are key drivers of wasteful medication spending in U.S. healthcare. Make sure to ask your PBM consultant about this next time they roll into town for dinner or a day on the links.
The same is true with the tizanidine product we selected. Most tizanidine dispensed in Medicaid is tablets, and not capsules. This is because Medicaid programs recognize that tizanidine 4 mg is likely to be effective whether provided as a tablet or a capsule and so they prefer the cheaper tablet dosage form over the more expensive capsule formulation for their beneficiaries.
Unfortunately, not all players within the U.S. drug supply chain act in payer’s best interest; so we draw your attention to these oddball dosage forms seeing price increases in case you want to inquire with your PBM to ensure that they are selecting the best, lowest cost options for your benefits plan.
As an aside, this is also a good reason for state legislatures and boards of pharmacy to allow pharmacists to alter dosage forms (when appropriate) so that these types of changes can be made at the pharmacy counter without the unnecessary hassle of having to circle back with physicians for something as trivial as a capsule vs tablet switch. What might seem like a tiny regulatory change can mean the difference in millions of dollars in prescription drug spend in each state. A growing number of states (see Figure 8 below) allow pharmacists to make these dosage form adjustments. Prior to the launch of 46brooklyn, our CEO was involved in pushing for this type of change in the state of Ohio in 2017 [see OAC 4729-5-30(C)].

Figure 8
Source: National Association of Boards of Pharmacy (NABP)
Thanks to the great folks at the National Association of Boards of Pharmacy for the list of states that make these scope of practice allowances for pharmacists.
7. ADPIT highlights upward price movements on some popular (but still very cheap) generics
Finally, let’s check in on our Abnormal Drug Pricing Increase Tracker (ADPIT) and see what it has to say about this month’s data. As a reminder, ADPIT takes all of the NADAC prices for one drug over any given 52-week period, ranks them, finds the 90th percentile for the price, and then compares the current price to that 90th percentile price. If the current price is above the 90th percentile, we consider the current week’s price to be “abnormal” and add it to the list for you to peruse. Then we do this for another 20,000 or so drugs for good measure to complete the list, shown in Figure 9.
If this is the first time you are seeing this, we include the number of annual Medicaid prescriptions for each of these abnormally priced drugs, and then two metrics we created – one called Relative Impact Ratio (RIR) and another called Relative Impact Score (RIS). RIR simply tells you how far above the 90th percentile a drug’s price currently is (i.e. polyethylene glycol at 1.13 means it’s 13% above its T-52 week 90th percentile price). RIS multiplies the number of annual Medicaid prescriptions by (RIR - 1) to size the impact of the “pricing abnormality” (for polyethylene glycol, 13% x 1,892,398 prescriptions = 242,860). Add up all the RIS for all of the drugs each week, take the four-week moving average, and you get the chart in bottom right of Figure 9 (which sizes the aggregate weighted impact each week). We then divide the bottom right chart into drugs with active ingredients in ongoing COVID-19 clinical trials, and all other drugs. Check out our interactive ADPIT tool here, and find more information on how to use it here and here.
Figure 9
Source: Data.Medicaid.gov, ClinicalTrials.gov, 46brooklyn Research
Overall, the dashboard continues to paint a relatively healthy picture for the generic marketplace, with aggregate RIS backtracking from its recent peak last month. Nearly a year after we created this dashboard, we continue to be pleasantly surprised on how well the generic marketplace has held up throughout the pandemic. While ADPIT has caught some price spikes on generic drugs, they have been the exception to the norm, which has been continued aggressive price deflation.
Thanks to Ed Silverman at STAT News for chatting with us about the big dust-up in Lehigh County, Pennsylvania, where the county controller, Mark Pinsley, has waged war over at least $1.4 in alleged overcharges on prescription drugs.
Thanks to Nikki Courtney at NewsRadio 740 KTRH in Houston for highlighting our analysis of January brand drug list price increases, along with providing commentary on some of the supply chain dynamics that are pressuring prices to rise.
Lastly, big shout-out to Chelsea Sick at WKEF/WRGT Dayton 24/7 Now for another deep dive into rising list prices on prescription drugs and also highlighting the perverse system of discounting that inflates those prices and creates inequities among those paying the bill for prescription drugs. Extra credit again for featuring our visualization tools in the piece and for the sharp-looking b-roll of the 46brooklyn headquarters.