
Annualized deflation on generic pills eclipses 20% in March
The CLIFF NOTES
On March 17, CMS published its latest update to the National Average Drug Acquisition Cost (NADAC) database. As a reminder, NADAC is the best national public database of surveyed pharmacy invoice costs to acquire prescription drugs. In other words, if you are looking to understand what pharmacies are paying to purchase drugs from their wholesalers each month (before rebates), and you don’t have tens of thousands of dollars buy this data, NADAC is where you must go.
As we’ve discussed at length over the years, NADAC is lagged by roughly two months. So the survey prices we just received in March reflect pharmacy invoice costs from January.
With regards to generic drugs, this month’s NADAC price changes resulted in another $39 million in annualized generic drug deflation based on Medicaid’s drug utilization. We know what you are thinking … that’s not all that impressive a number given that in the past three months have averaged $67 million in annualized generic drug deflation, and five months ago, there was $244 million in annualized generic drug deflation in a single month. But all of this deflation adds up over time, which brings us to our key takeaway on generic drugs this month: year-over-year (YoY) deflation on oral solids has – for the first time since we started tracking generic deflation – eclipsed 20%.
This milestone has been largely driven by steep price declines on widely used prescription drugs like methylphenidate (generic Concerta), colchicine (generic Colcrys), cinacalcet (generic Sensipar), and buprenorphine-naloxone (generic Suboxone).
Overall generic drug deflation jumped as well this month, rising to 15%, which was the highest percentage deflation since March 2019. Annual deflation on non-oral-solids was overwhelmingly driven by two drugs – oseltamivir suspension (generic Tamiflu) and buprenorphine-naloxone films (generic Suboxone films).
The magnitudes of the cost declines on these generic drugs over the past year (which we detail below in this report) has been truly astonishing and is most certainly a blessing for those Medicaid programs and other plan sponsors that are actually paying for generic drugs directly based on their acquisition cost. For those that are not (i.e. those programs still paying for generic drugs based on average wholesale price or AWP… you know who you are … and if you read our work regularly, you should know better by now), we’re sorry to say that you will not see the benefits of this massive haul of savings. We tip our hat to the pharmacy benefit managers (PBMs) and managed care companies who are enriching themselves off this tidal wave of generic drug deflation while simultaneously convincing their taxpayer-funded state clients that they are saving them money. (Sorry, New Yorkers)
With regards to brand drugs, the 46brooklyn Brand Drug List Price Change Box score (which tracks changes in brand drug wholesale acquisition costs) reveals just 16 price increases in March, the lowest number for the month of March over the last decade (and down from a high of 82 in March 2015). However, we’re already noticing a good amount of price increases in April, which is something we will keep an eye and report next month.
For those of you interested in more details, here we go.
Brand Name Medications
1. Brand drug price changes worth taking note of in March
While most of the drug pricing focus for states and Congress remains on brand name drug increases (as it was in January), we started off our last report discussing a few drug brand price decreases in February. Well, as you can see from our Box Score, this month there are no price decreases to speak of, so we can skip right to the increases.
The largest brand drug list price increase in March was 32% and occurred on Conjupri tablets. This list price hike percentage is the largest so far this year, and the the steepest since October 2020.
Surprisingly, this isn’t a medication to treat cancer but rather a somewhat ordinary, run-of-the-mill medication used to treat hypertension. Or at least it would be ordinary, if it wasn’t for its high list price and price increase on a medication that was approved just over a year ago.
Structurally, Conjupri (levamlodipine) is little more than a specific configuration (an enantiomer) of amlodipine (generic Norvasc). And before you ask if this specific configuration makes a difference, there does not appear to be any meaningful clinical difference in terms of efficacy between Conjupri and amlodipine, though there may be less leg swelling with Conjupri. So while there may be some difference, it’s likely not enough for most patients (or their bodies) to notice. For those of you with kids, we have embedded a fun visual skills challenge in Figure 1 as means to get them to take a break from the constant loop of Scary Flying Shark and place their a toe in the water to see how they respond to the hyper-entertaining world of pharmaceutical molecular structures.
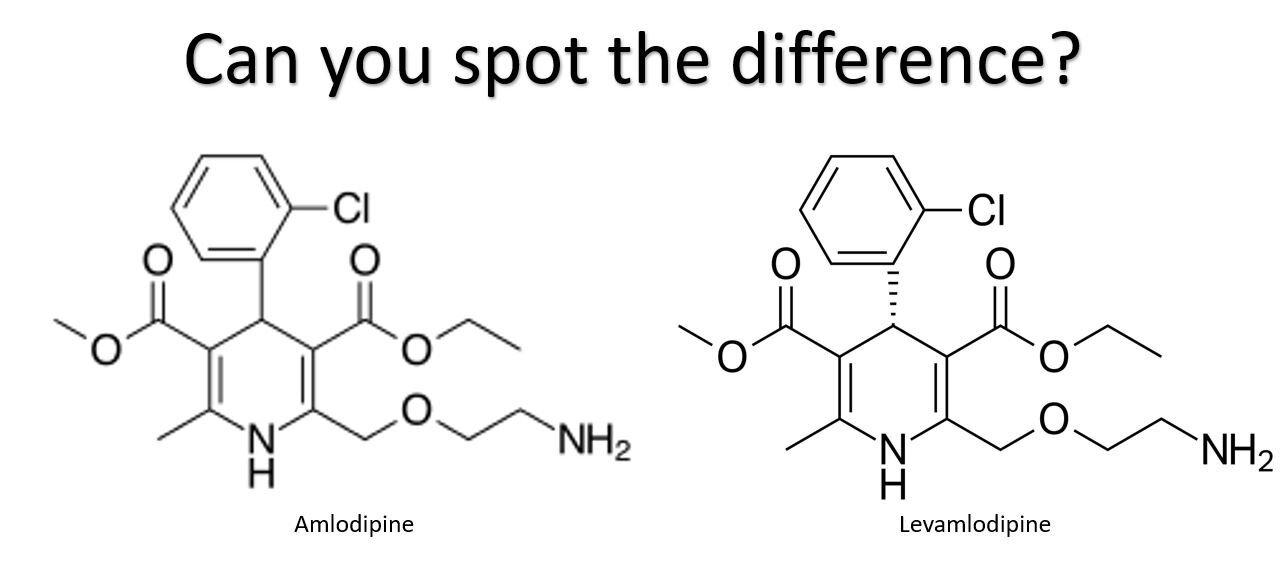
Figure 1
Source: wikipedia.org
Conjupri is one of the rare drugs that does not have a NADAC price, but the NADAC price for amlodipine is approximately $0.01 per pill. Our channel checks inform us that Conjupri’s acquisition cost is more than 1,000 times greater than generic amlodipine. This story of higher costs with a new treatment that offers little to no benefit to existing therapy is an all too familiar story in the U.S. drug pricing world. Perhaps the most famous example of enantiomer product hopping is omeprazole and esomeprazole which you can read more about here.
Fortunately, it doesn’t appear that big payers – at least in the Medicaid space – have taken the bait on any potential rebates CSPC Ouyi Pharmaceutical Company may be offering to try and acquire Conjupri market access, as there is no utilization identified in Medicaid’s State Drug Utilization Data (SDUD). We can only speculate that with this hefty list price increase, CSPC Ouyi may be trying to juice the rebate pot by increasing its gross to net bubble to entice some of the payers that perhaps more aggressively seek rebates into covering the medication. We suspect that so long as prescribers remain diligent and cognizant of price – something they do not always recognize – the market penetration for this drug will likely continue to be small in 2021.
Overall, the most significant brand list price increase in March, as measured by total gross Medicaid dollars impacted, was Korlym tablets (mifepristone). Last year, before discounts, Medicaid spent a combined $23.2 million on Korlym. At a 5% increase, total Medicaid expenditures could increase $1 million due to this price increase. Of course, the Medicaid Drug Rebate Program (MDRP) will likely negate the impact of this price increase to the Medicaid program, but that may not be the case for commercial payers who may not receive all available rebates and discounts for Korlym, or for patients without coverage or in high deductible health plans who will feel just about every bit of the increase.
The increase comes at a busy time for Korlym’s manufacturer, Corcept Therapeutics, who has already had its hands full in the courts in attempts to fend off generic competition from Sun Pharmaceuticals and Teva Pharmaceuticals. Shortly after Corcept’s 5% list price increase registered on March 1, they dug in deeper into the patent litigation front, filing a lawsuit against Hikma Pharmaceuticals for what Corcept alleges as Hikma’s violation of four patents in their pursuit of bringing a proposed generic version of Korlym to market.
Of course, all of the litigation delays aren’t all bad news for Sun, Teva, Hikma, and other would-be market entrants. While generic competition for Korlym awaits prolonged legal battles over tangled patent thickets, if Corcept keeps raising prices throughout the litigation process – as they did last month – the rising AWP for the brand will likely give birth to a higher AWP for all generic competitors once they are finally able to come to market. For more on this relationship between brand AWPs and generic AWPs, see our 2019 report on drug launch prices.
Generic Medications
1. A favorable unweighted price change picture
Each month, we look at how many generic drugs went up and down in the latest month’s survey of retail pharmacy acquisition costs (based on NADAC), and compare that to the prior month (Figure 2).
Basically, the quick way to read Figure 2 is to look for blue bars that are taller than orange bars to the left of the dotted line, and exactly the opposite to the right of the dotted line. That would indicate a good month – more generic drugs going down in price compared to the prior month, and less drug prices going up.
Figure 2
Source: Data.Medicaid.gov, 46brooklyn Research
So how did we do this month? Blue bars taller than orange bars to the left of dotted line… Check. Blue bars shorter than orange bars to the right of dotted line… Check, again. Long story short, generic drugs followed the script (no pun intended) once again this month and deflated, at least on an unweighted basis. Putting some numbers to this, for every drug that increased in price this month, 1.32 drugs decreased in price. That’s up from a ratio of 1.08 last month.
But as usual, take this unweighted price change analysis with a grain of salt. To really make heads or tails of all of these pricing changes, let’s weight these changes.
2. Weighted Medicaid generic deflation comes in at $39 million
The purpose of our NADAC Change Packed Bubble Chart (Figure 3) is to apply utilization (drug mix) to each month’s NADAC price changes to better assess the impact. We use Medicaid’s 2019 drug mix from CMS to arrive at an estimate of the total dollar impact of the latest NADAC pricing update. This helps quantify what should be the real impact of those price changes from a payer’s perspective (in our case Medicaid; individual results may vary).
The green bubbles on the right of the Bubble Chart viz (screenshot below in Figure 3) are the generic drugs that experienced a price decline (i.e. got cheaper) in the latest survey, while the yellow/orange/red bubbles on the left are those drugs that experienced a price increase. The size of each bubble represents the dollar impact of the drug on state Medicaid programs, based on utilization of the drugs in the most recent trailing 12-month period (i.e. bigger bubbles represent more spending). Stated differently, we simply multiply the latest survey price changes by aggregate drug utilization in Medicaid over the past year, add up all the bubbles, and get the total inflation/deflation impact of the survey changes.

Figure 3
Source: Data.Medicaid.gov, 46brooklyn Research
Overall, in January, there was $73 million worth of inflationary drugs, offset by $112 million of deflationary generic drugs, netting out to $39 million of deflation for Medicaid. While this is still an impressive amount of deflation, it feels like somewhat of a letdown after getting spoiled by much higher deflation estimates in the latter part of 2020.
Before we dive into some of the specific drug details, we have one more top-down analysis to run – that is to investigate how generic drug prices are trending over time.
3. Year-over-year generic oral solid deflation eclipses 20%
Ever since last June, we have been tracking year-over-year generic deflation for all generic drugs that have a NADAC price. We once again weight all price changes using Medicaid’s drug utilization data. Beginning in August 2019, we had been seeing a gradual compression in deflation (Figure 4). But oddly enough, as the pandemic started, this trend started to reverse, only starting to return over the last few months. This month, oral solid generic deflation eclipsed 20% year-over-year (YoY), pushing well above the +1 standard deviation line. Deflation on all generics also increased meaningfully to 15.1%.
Figure 4
Source: Data.Medicaid.gov, 46brooklyn Research
4. The drugs underlying March’s milestone deflation
Crossing the 20% deflation mark is an important milestone, in our view. Remember, just one year ago we were trending towards inflation, and now we are not only back in double-digit deflation, but above 20%? It’s worth repeating that this was not supposed to happen. COVID-driven supply chain constriction was predicted to crimp supply of our key generic drugs, driving up their price, at least according to your friendly neighborhood drug pricing enthusiasts at 46brooklyn. We weren’t alone in those predictions. But what do we (or anyone) know about predicting the future? We’d better stick to what we are good at, which is analyzing data. So to that end, let’s get back into our lane and dig deeper into this month’s year-over-year generic deflation number to see the drugs responsible for most of the deflationary carnage.
First off, consider these six drugs mentioned in the cliff notes:
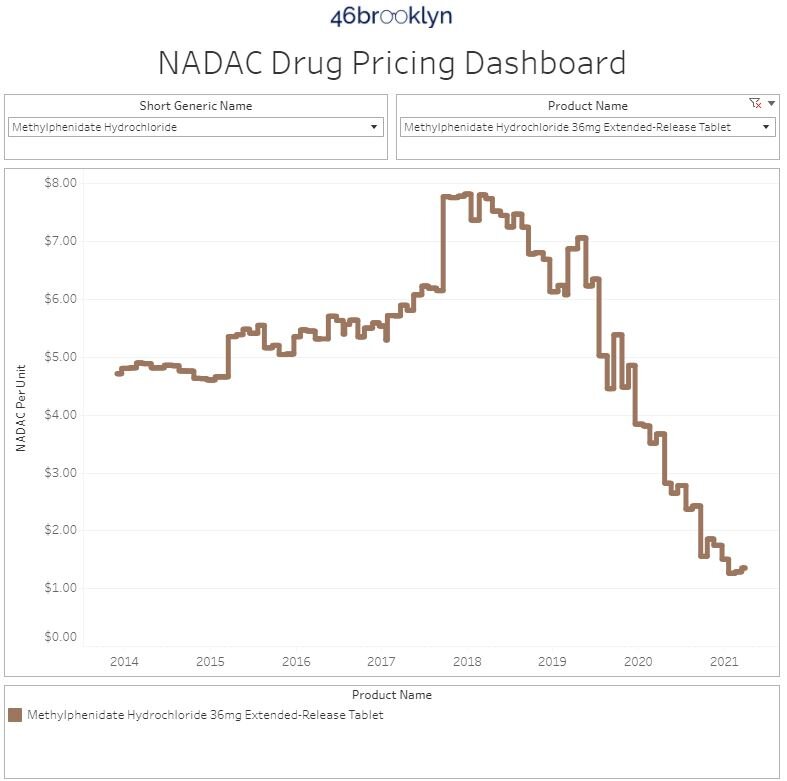
Methylphenidate (generic Concerta) - NADAC down 57% YoY
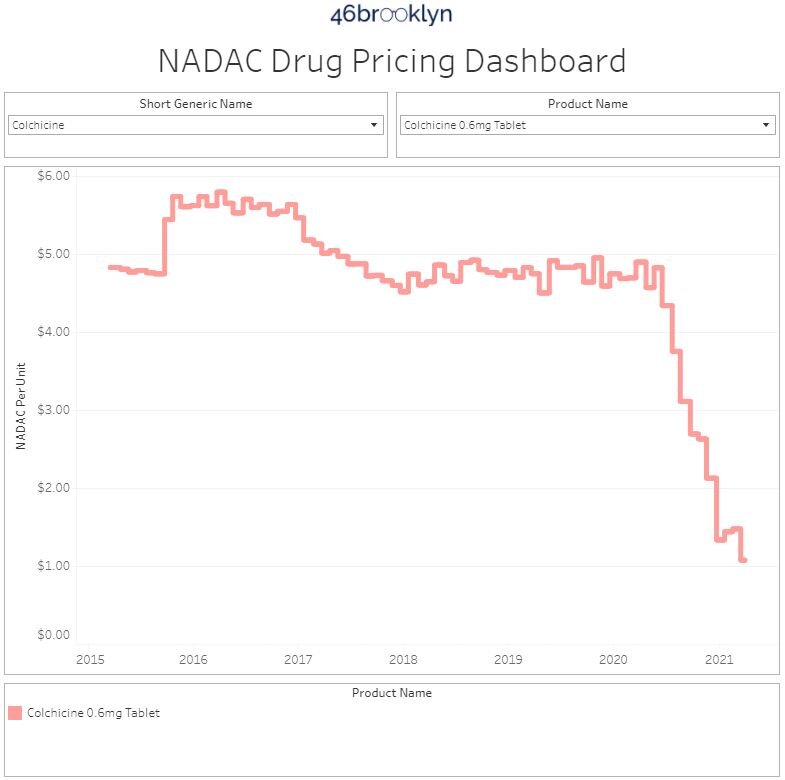
Colchicine (generic Colcrys, Mitigare) - NADAC down 78% YoY
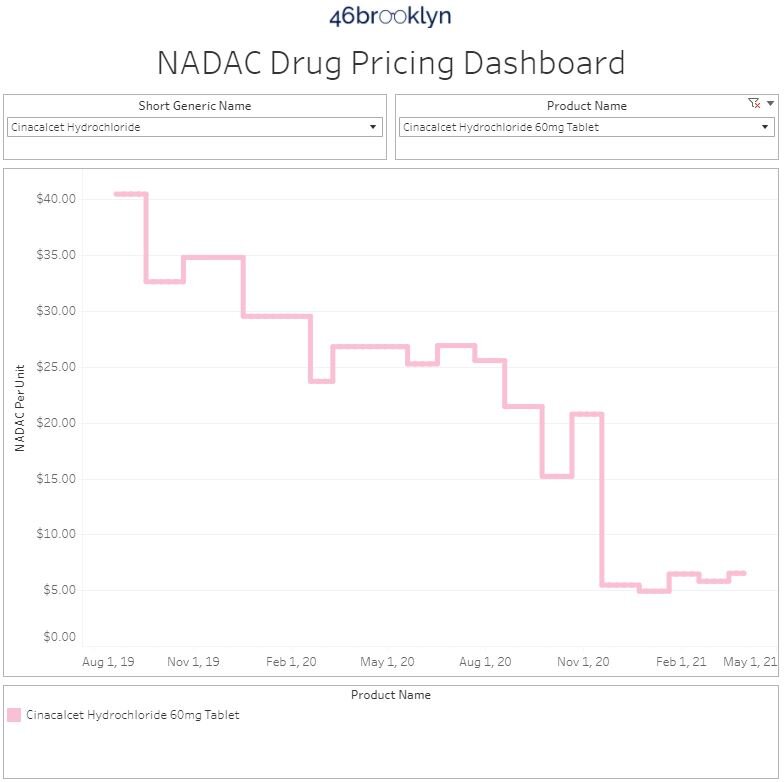
Cinacalcet (generic Sensipar) - NADAC down 80% YoY
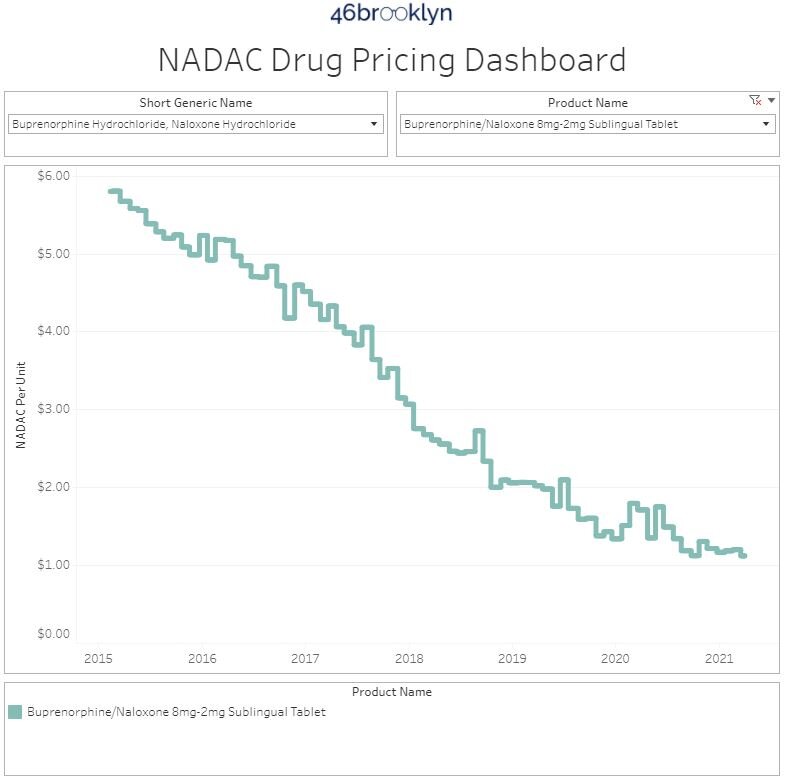
Buprenorphrine-naloxone tablets (generic Subxone tablets) - NADAC down 33% YoY
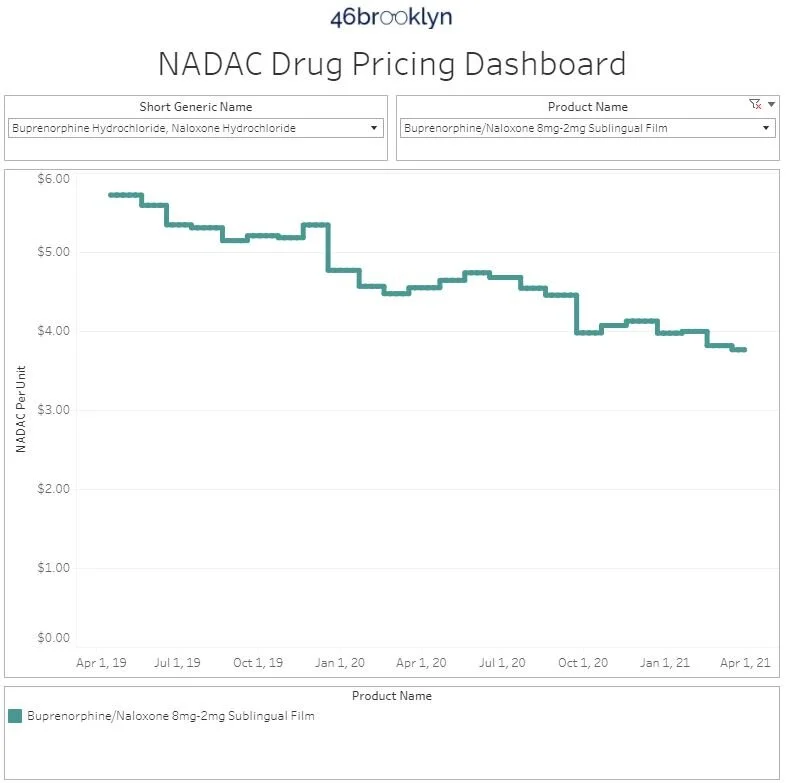
Buprenorphrine-naloxone films (generic Subxone films) - NADAC down 17% YoY
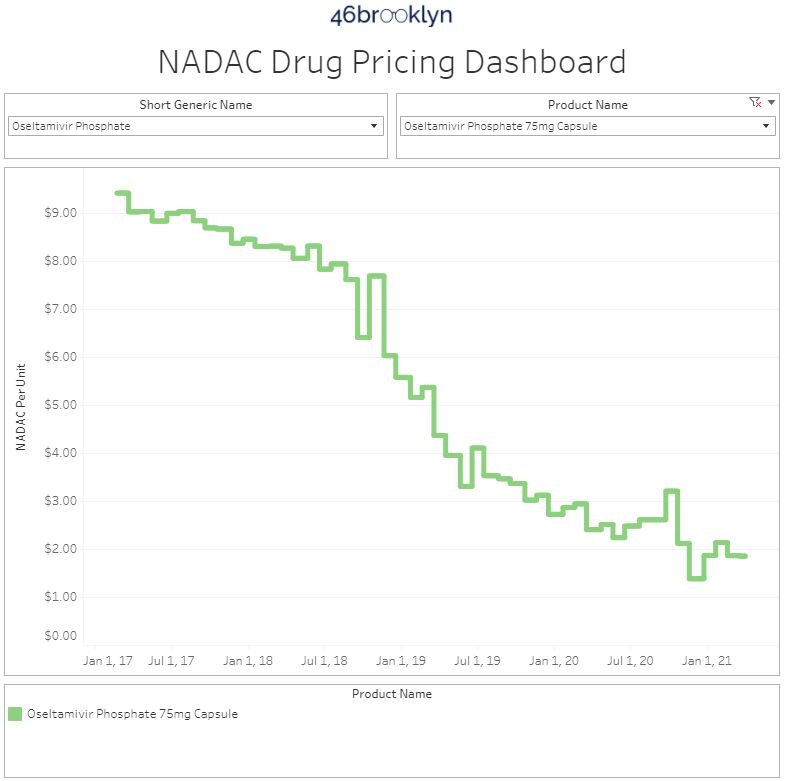
Oseltamivir solution (generic Tamiflu) - NADAC down 37% YoY
These six drugs comprised roughly 11% of Medicaid’s gross spending on generic drugs in 2020 (through Q3), yet drove 29% of the overall NADAC deflation from March 2020 to March 2021. That’s because the weighted average deflation across the group was a whopping 41%.
Put it all together, and nearly a third of overall Medicaid deflation was driven by just six drugs (five if you consider different forms of generic Suboxone to be “one drug”). The following carousel shows the drop-offs in pricing on these six drugs. Many of these you have already seen (multiple times for methylphenidate). But some (colchicine and cinacalcet) are long overdue new entrants into this report, especially given their heavy Medicaid utilization.
5. ADPIT has nothing to say in the face of all this generic drug deflation
Finally, let’s check in on our Abnormal Drug Pricing Increase Tracker (ADPIT) and see what it has to say about this month’s data. As a reminder, ADPIT takes all of the NADAC prices for one drug over any given 52-week period, ranks them, finds the 90th percentile for the price, and then compares the current price to that 90th percentile price. If the current price is above the 90th percentile, we consider the current week’s price to be “abnormal” and add it to the list for you to peruse. Then we do this for another 20,000 or so drugs for good measure to complete the list, shown in Figure 5.
As we turned to examine ADPIT this month, we were surprised by the lack of any drugs with meaningful abnormal increases. Nothing is jumping off the page to us, but please let us know if you think we missed something. It is certainly worth noting that when it coms to ADPIT, no news is extremely good news!
Figure 9
Source: Data.Medicaid.gov, ClinicalTrials.gov, 46brooklyn Research
Note: The original version of this report incorrectly attributed Conjupri’s manufacturing to Larken Laboratories, when in fact, the manufacturer of the product is CSPC Ouyi Pharmaceutical Co. The report has been updated to reflect this.
Thanks to Ed Silverman at STAT News for chatting with us about the big news out of Ohio, where state Attorney General Dave Yost is suing Centene over alleged overcharges on prescription drug claims in the Ohio Medicaid program. For those uninitiated, our story began in Ohio, where we worked to uncover the massive disconnect between pharmacy prescription payments and what the state Medicaid program was being charged for those same claims. While the identified problems were by no means limited to just Centene, the litigation is in many ways borne out of the beginning of our journey to diagnose drug pricing dysfunction.
Congratulations to Michael Kinch and Lori Weiman on this week’s release of their new book, The Price of Health. The work is a great journey into the abyss of prescription drug pricing and the supply chain, examining a number of flaws embedded in the system. We’d like to thank them for including us in their research, and for featuring a number of our analyses throughout the book.