
A quarterly-ish review of U.S. drug price changes
As a non-profit, we at 46brooklyn have made it our goal to provide insights into U.S. drug pricing data available in the public domain based upon the figures we are able to get our nerdy hands on. While we try to do these reports monthly, sometimes the months get away from us, and we get behind (if that upsets you, we always welcome more gas in the tank to keep us cooking at our normal cadence). These past few months have been one of those times (our last review was of March price changes), so forgive us as we provide not a monthly review of drug prices today, but an almost quarterly review of drug prices from April, May, June & July.
In the news, between April and July 2025, the drug pricing world looked like a rollercoaster in Washington, with manufacturers strapped in whether they liked it or not. The Trump Administration made its presence felt through a pair of executive orders that promised fireworks but left everyone guessing about what, exactly, the grand finale would look like. On April 15, the White House zeroed in on reducing prescription drug costs, dangling carrots like faster generic drug approvals while threatening with sticks for anti-competitive practices. Less than a month later, the President upped the ante with a “most-favored-nation” (MFN) gambit on May 12 — essentially saying U.S. prices should stop living in their own inflated bubble and instead track the cut-rate drug pricing benchmarks set abroad. The U.S. Department of Health & Human Services (HHS) followed up with marching orders, directing manufacturers of single-source brand drugs to voluntarily play ball and align their prices with MFN benchmarks. By June 11, the agency wasn’t just handing out guidelines — it was effectively the ride operator at Pharma World, strapping companies into the MFN coaster and pulling the lever whether they were ready or not. “Keep your hands inside the pricing structure at all times,” seemed to be the vibe, as HHS sent out formal MFN price targets with the expectation that manufacturers would hang on and comply — no fast passes, no exit ramps. But when negotiations seemed to fizzle, the ride shifted into a bumpy turn. In July, pharmaceutical companies received sharply worded letters from the White House, giving them a deadline of September 29 to fall in line with the administration’s expectations or face consequences; consequences that are still nebulous but clearly intended to be unpleasant.
Whether MFN pricing is actually enforceable across all markets is another matter. Legal scholars and industry insiders continue to circle the same federal programs — Medicare and Medicaid — as the only viable zones where HHS has enough leverage to test the model. But even limited MFN enforcement would represent a seismic shift in how the U.S. regulates (or not) drug prices in the U.S.
Then came the tariffs. Yes, tariffs being talked about in relation to drugs. In a move that delighted trade hawks and horrified drug supply chain managers, the administration floated the idea of taxing imported drugs, supposedly to punish overseas price manipulation and encourage domestic production. But the policy opened a Pandora’s box: economists warned of likely price hikes, distributors worried about shortages, and public health officials raised red flags about potential access disruptions — particularly for generics heavily sourced from India and China. Tariffs may have started as political theater, but they’re now a serious variable in 2025’s pricing equation, especially if enacted alongside MFN enforcement.
Meanwhile, industry players were anything but idle. Many drug manufacturers went ahead with quiet price increases on key branded products (see our update below, July remains the second biggest month for brand drug list price changes). But not everyone follows the same playbook — other drug manufacturers zigged the other way, announcing selective cuts for certain drugs.
The FDA made headlines with a push for streamlining prescription-to-OTC switches, while HRSA stoked controversy with its July launch of a 340B rebate pilot program, drawing both applause and alarm from stakeholders still reeling from previous 340B drama.
Underneath it all, sentiment in the biopharma sector remained soft. Equity markets slumped, IPOs lost momentum, and M&A deals thinned, as uncertainty around MFN, IRA implementation, and tariff risk kept investors on the sidelines. Employers continued to sound alarms over specialty drug costs, especially as GLP-1 demand refuses to cool, while advocacy groups and lawmakers alike renewed calls for transparency — and accountability.
So, what’s next? That’s the billion-dollar question. With policy deadlines looming, tariffs on the table, and enforcement mechanisms still murky, the second half of 2025 promises to be even more unpredictable than the first. Stay tuned for more, but if you want to get caught up on what the data is telling us read on.
The Cliff Notes from these past months’ drug price changes
There were a net of 56 brand list price changes in April (60 increases offset by 4 decreases), 24 in May (26 increases; 2 decreases), 21 in June (23 increases; 2 decreases), and 159 in July (162 increases; 2 decreases). With so many price changes, you would probably not be surprised to learn that the degree of list price changes were all over the map.
The biggest decrease over our timeframe of April to July 2025 was a 76% list price decrease for the product Vasostrict by Endo pharmaceuticals. The biggest increase was on Galzin by Eton pharmaceuticals, which saw its WAC list price increase over 1,200% in June 2025 (now over $10,000 per bottle of pills). We’re pretty sure this is our new winner for all time biggest list price change. Of course, as meaningful as that list price change is on paper — it does mean that the drug is likely to be free, or better than free, to Medicaid (and penny priced by extension to 340B providers) thanks to the Medicaid Drug Rebate Program and the CPI penalty which drives Unit Rebate Calculation (URA). In a weird way, this might mean it complies with MFN pricing — because we don’t think any other country gets the drug for free, or better than free (an insane calculus to be sure). Which is another way of saying, if you happen to need that medication outside of government programs like Medicaid and 340B, expect to pay for it to cross-subsidize the losses the manufacturer incurs on the drug for those programs. And those aren’t our words; that’s what Eton pharmaceuticals said about the last drug of theirs that was highlighted for seeing such a big list price increase.
All that said, other drugs we’d highlight as noteworthy during this timeframe, per our typical standards, are:
Trikafta (manufactured by Vertx pharmaceuticals) saw a 7% list price increase in July, impacting $2 billion in gross prior year Medicaid expenditures (PYME)
Xolair (Genentech) saw a 4% list price increase in July, impacting $1.2 billion in PYME
Cosentyx (Novartis) saw a 3% list price increase in July, impacting $808 million in PYME
Cabenuva (ViiV) saw a 2.5% list price increase in July, impacting $500 million in PYME
Yuflyma (Celltrion) saw a 71% list price decrease in May, impacting $4.2 million in PYME
Lysodren (HRA Pharma) saw a 15% list price increase in April, impacting $1.3 million in PYME
On the generic side of the coin, things have been a little wacky. You may recall that April to July 2024 were a little wacky due to inconsistencies in National Average drug Acquisition Cost (NADAC) reporting, which means that when we look back for year-over-year (YoY) insights on generic prices, things are generally looking worse now than they did then. Some people talk about the difficulties of a “tough comp” when it comes to measuring inflation, and we think those same kind of concepts apply here. But regardless, for the first time ever in our price tracking, the months of April, May and July show generic inflation — not deflation — in our year-over-year monitoring. For more on that, read the companion report here.

Figure 1
Source: Data.Medicaid.gov, 46brooklyn Research
If you’re only looking for the high-level overview, then hopefully the above meets your needs. If you want more of the details, read on.
What we saw from brand-name medications from April to July
1. A small number of brand drug list price changes
There were a net of 56 brand list price changes in April (60 increases offset by 4 decreases), 24 in May (26 increases; 2 decreases), 21 in June (23 increases; 2 decreases), and 159 in July (162 increases; 2 decreases). Recall that when we say list price, we mean a change in the wholesale acquisition cost (WAC), which is featured and contextualized in our Brand Drug List Price Change Box Score.
Price changes this month ranged from -76% (i.e., a list price decrease) to +1,200% (yeah, more than 10x the WAC price it was previously). As a reminder, brand price increases in Medicaid and for 340B purchasers are largely held in check thanks to the Medicaid Drug Rebate Program (MDRP), which includes rebate penalties for drug price increases that occur faster than the rate of inflation. Over the past 12 months ending July 2025, the overall inflation rate was 2.7%, so any drug that increased faster than that rate is likely to incur an inflation penalty for Medicaid, 340B, and now, Medicare.
This is one of a number of reasons that solely analyzing brand list price changes provides an incomplete picture of what’s really happening with brand manufacturer economics, thanks to the growing lot of opaque rebates, discounts, and giveaways that drugmakers shave off those list prices. But alas, until drugmakers, PBMs, insurers, wholesalers, 340B covered entities, and rebate aggregators make more granular data on net prices public, we’ll continue working with what we’ve got.
2. Brand price trends over time

Figure 2
Source: Elsevier Gold Standard Drug Database, 46brooklyn Research
To help contextualize brand name drug list price increase behavior, we find it beneficial to review past trends. In comparison to the data from prior years, 2025 is shaping up to be right in the middle of the 2023 and 2024 trend (in terms of overall price increase behavior). If we look at Figure 2 on the right, we see that in tracking the net number of price changes (increases minus decreases), the blue 2025 line is right between the high red line (2023) and low orange line (2024) trend.
Of course, looking at just the count of drugs taking price changes doesn’t necessarily paint a fully formed picture of what is going on, but it is a start.
And while we cannot contextualize all the brand pricing behavior we would like (looking at you secret rebates or non-public Average Manufacturer Prices [AMP]), when we look at the next behavior, the degree of list price change, we see that of the brand drugs that took a list price changes so far this year, the median price increase is 4.0% — a percentage that has trended slowly downward since 2019. And when we try to weight the brand list price behavior (using Medicaid state drug utilization data as our measuring stick), we see the weighted average price increase is also 4.0%. Outside of the weirdness that happened in 2024 (with the insulin list price decreases), we see fairly consistent results between our median and average measure over the last seven years or so (Figure 3 below).

Figure 3
Source: Elsevier Gold Standard Drug Database, CMS State Drug Utilization Data, 46brooklyn Research
3. Brand drug list price changes worth taking note of across April to July 2025
We identify drugs worth taking note of in a couple different ways. Primarily, we look for medications with a lot of prior Medicaid expenditures. We next look for drugs with large pricing changes (+/- 10%). And finally, we look for drugs that are interesting for us either because we’ve previously written on them or because we find them of unique clinical value. This month, when looking for these drugs in the brand arena, we have several of each worth mentioning:
Trikafta oral tablets (elexacaftor/tezacaftor/ivacaftor) is a medication indicated to treat cystic fibrosis in people 12 and over with the F508del mutation. This medication saw a 7% list price increase in July, impacting $2 billion in gross prior year Medicaid expenditures (PYME). Trikafta has received attention from groups like the Institute for Clinical and Economic Review (ICER) and the Colorado Prescription Drug Affordability Board in regards to its pricing and affordability. The folks at Patients for Affordable Drugs have been a dog on a bone for the drug for a long time now and were predictably triggered with the news of the increase as well. With an annual cost estimated to be hundreds of thousands of dollars annually (estimate likely does not reflect any rebates/concessions), even though cystic fibrosis impacts an estimated 40,000 in the U.S., the drug is a prime example of how drugs with great clinical outcomes (like life-saving for those who need it) can still face challenges in regard in their prices (list & net). Note that Vertex, the manufacturer, does appear to offer patient financial assistance for their drugs, including Trikafta, with copay support capped at $20,000 annually.
Xolair (omalizumab) is an injectable medication used to treat severe asthma and allergic reactions. This medication saw a 4% list price increase in July, impacting $1.2 billion in PYME. This is a medication that is intended to be taken every two to four weeks for control, not for treating acute attacks (administered either by a healthcare provider or self-administered at home). Xolair has also been studied by ICER in regards to its asthma pricing. The manufacturer of Xolair also offers patient assistance, with copay support capped at $15,000 annually.
Cosentyx (secukinumab) is an injectable medication used to treat several types of inflammatory skin conditions. This medication saw a 3% list price increase in July, impacting $808 million in PYME. In the same month that this list price change occurred, Novartis released some disappointing results of a Phase III clinical trial regarding Cosentyx for rare arteritis disease state. Again, Cosentyx has been reviewed for its affordability by groups like the Colorado Division of Insurance and ICER. Again, the manufacturer offers patient assistance programs — including up to two years of the medication for free if the patient qualifies.
Cabenuva (cabotegravir/rilpivirine) is a long acting injectable medication used to treat HIV infection. This medication saw a 2.5% list price increase in July, impacting $500 million in PYME. In 2022, Viiv announced it was allowing 90 countries to make affordable generic versions of their cabotegravir to support broad access to therapies in places that might not otherwise be able to afford them. We didn’t find an ICER report on Cabenuva, but others have looked at injectable HIV products and found that the price would have to be low or of little premium to the existing generic options to meet the thresholds of those studies. The drug manufacturer does offer patient assistance, with support appearing to be differentiated by whether the healthcare practice gets the medication through the ViiV-selected specialty pharmacy or whether the practice independently manages the process of drug acquisition and insurance authorization.
Yuflyma (adalimumab-aaty) is a biosimilar to Humira used to treat a variety of inflammatory conditions. This medication saw a 71% list price decrease in May, impacting $4.2 million in PYME. In May 2025, Yuflyma received interchangeability designations for all its approved dosage forms and strengths from the FDA. And unlike what we typically see after a brand gets expanded FDA indications, the price has not increased. That said, even with the list price decrease, it is generally a higher price, on a WAC-basis, than other Humira biosimilars. Although it has been almost a decade, ICER did look at Humira prices back in 2017. Again, the manufacturer is offering financial assistance to patients who may have difficulties affording Yuflyma.
Lysodren oral tablet (mitotane) is used to treat inoperable, functional or nonfunctional, adrenocortical carcinoma (ACC) and has an unknown mechanism of action. This medication had an increase in WAC of 15.0%, resulting in an increase of $1.3 million in PYME. We didn’t find any ICER or other reports on Lysodren affordability, but do note that there does appear to be patient support available from the manufacturer.
Note an earlier version mistakenly mis-identified the mechanism of action and use of this drug.
Vasostrict (vasopressin) is an injection used to increase blood pressure in adults experiencing vasodilatory shock. This medication saw a WAC decrease of 75.9% in April, impacting $3 million PYME. There are generic versions of this medication on the market. While there are some historic reportings of Vasostrict affordability challenges for hospitals, we did not find any formal studies by ICER or others on this product, nor did we find any information about patient assistance for this drug.
Galzin (zinc acetate) is an oral capsule used to treat Wilson disease. This medication saw an increase in WAC of 1,224% in June 2025 impacting $0 PYME. Eton Pharmaceuticals, the current manufacturer of Galzin, has come across our radar before. As we discussed in the intro, they’re the manufacturer who effectively told everyone that price increases are about cross-subsidizing the various groups that finance the U.S. healthcare system. By raising prices of their medications, the company knows and acknowledges they give bigger discounts to federal programs (think Medicaid and Medicare), but that it may be worth doing just that in order to get more money out of everyone else (i.e., private healthcare — the majority of us). If that sounds crazy, we encourage you to read the excellent reporting around this insane calculus from Ed Silverman at STAT News. Now because this medication has historically been less than $1,000 a bottle, we’re not surprised to not find any historic discussions by ICER or others about affordability related to this drug, but do note that the manufacturer does appear to offer patient financial assistance for this medication (while also appearing to limit the dispensing of this medication to an exclusive, designated specialty pharmacy [which if we’re speculating, may be to try to limit the reach of the 340B contract pharmacies]).
You may notice that this month, we spent time talking about some of the cost-effectiveness studies for each of this drugs. While this is a divergence from the normal format we take on these reports (which generally just focus on the data from the Brand Box Score), we thought it would be helpful in the context of the current conversation about drug price negotiation or discounting or MFN. As we have long lamented, it would be nice if we had public data on net prices for brand drugs. Efforts like the Consolidated Appropriations Act had requirements for net drug price disclosure by health plans to the federal government, whereas the Transparency in Coverage (TiC) rule were supposed to require publishing information on net drug prices to the public (hasn’t actually come to be yet) speak to how much interest there is in knowing these prices, but yet the information is concealed from us.
Take Trikafta as an example, the ICER report said it would meet their cost-effective thresholds at an approximate 73% reduction in price. Whether you agree with ICER and their assessment or not, do we know if Trikafta discounted to that degree? Nope. We can see that if we compare say the WAC price against the Big 4 price, there is a 33% reduction from the WAC to get to the Big 4 price, which while not the full 73% reduction that ICER would target, may mean the difference between that target ICER price and where net prices may actually be may not seem as large as it does on its surface.
The same is true for a medication like Xolair. The ICER report said it would need an approximate 50% reduction in its list price to meet the ICER cost effectiveness thresholds. Again, whether you agree or not with ICER and their methods, using Big 4 as a gauge for whether that level of discounting exists in the real world demonstrates a WAC-to-Big-4 delta of 48%, which basically at the ICER threshold. We think these observations are helpful to the broader question of why we have rebates and discounts in the first place, and who benefits from their existence? We’re not sure we have the answers (just kidding; we do), but we’re pretty sure it’s not the people who don’t know what the actual prices of things are. For a more technical write up on this, we’d encourage you to pursue what Bancreek wrote on healthcare price discrimination in a recent blog post, as it gets to the heart of some of where these value prop differences actually live.
What we saw from generic medications from April to July
4. A favorable, unweighted price change picture
To start on the generic side of the coin, we look at how many generic drugs went up and down between the April and July survey of retail pharmacy acquisition costs (based on National Average Drug Acquisition Cost, NADAC). As can be seen below in Figure 4, from April to July, when the same generic drug price can be compared one to the other (using April as the base), we see about 1.4 products (NDCs) decreased for every one that increased.
Figure 4
Source: Data.Medicaid.gov, 46brooklyn Research
Based upon a quick eye check, Figure 4 seems to show more drugs decreasing over our time in our analysis, which may be an early indicator of generic savings. But as we’ve said before, if an un-utilized drug is decreasing in price and a heavily utilized drug is increasing in price, then this unweighted view of price behavior can be a little deceptive in terms of broader system impact. No one cares if the drug they’re not buying got cheaper (did you see any stories about the Yuflyma price decrease?), so we need to try to weight the experience of price changes to see whether the drugs that are decreasing in price are the drugs people are generally using.
5. Weighted Medicaid generic drug costs come in at $84 million deflation over the fourth-month stretch
The purpose of our NADAC Change Packed Bubble Chart is to apply utilization (drug mix) to each month’s NADAC price changes to better assess the impact. We use Medicaid’s drug mix from CMS to arrive at an estimate of the total dollar impact of the latest NADAC pricing update. This helps quantify what should be the real effect of those price changes from a payer’s perspective (in our case, Medicaid; individual results will vary).
The green bubbles on the right of the Bubble Chart viz (screenshot below for all months in a slide show) are the generic drugs that experienced a price decline (i.e. got cheaper) in the latest price survey, while the yellow/orange/red bubbles on the left are those drugs that experienced a price increase. The size of each bubble represents the dollar impact of the drug on state Medicaid programs, based on utilization of the drugs in the most recent trailing 12-month period (i.e. bigger bubbles represent more spending). Stated differently, we simply multiply the latest survey price changes by aggregate drug utilization in Medicaid over the past full year, add up all the bubbles, and get the total inflation/deflation impact of the survey changes.
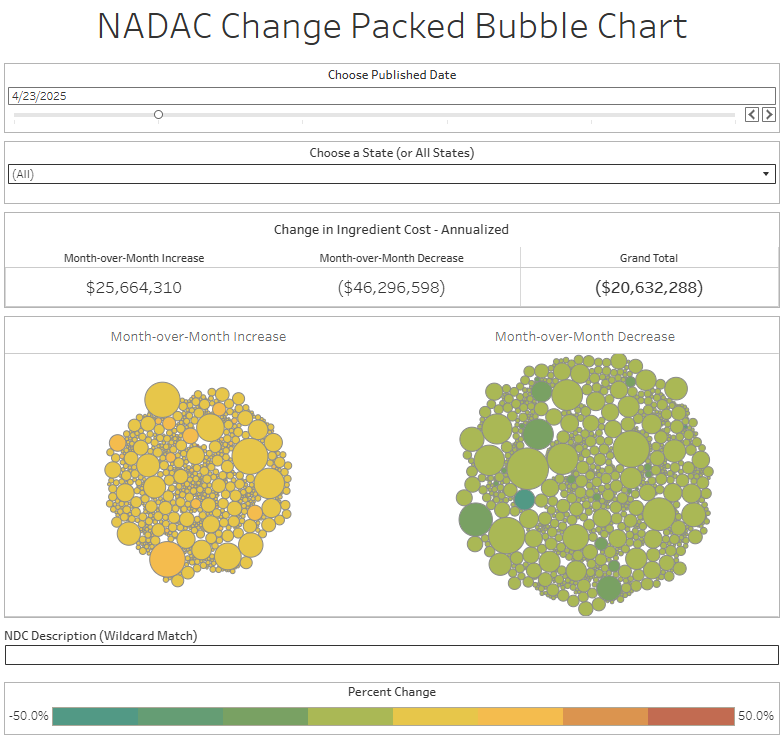
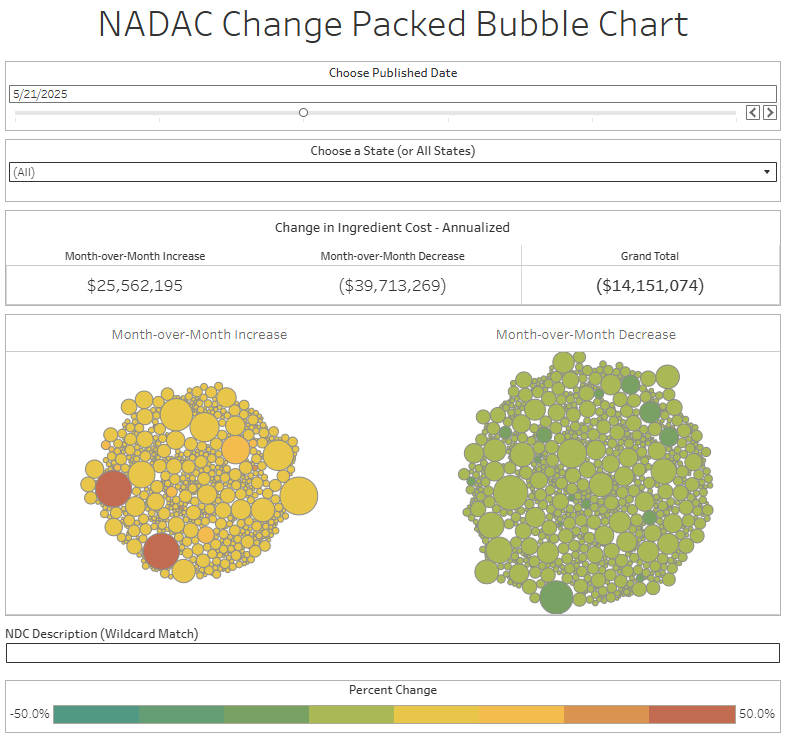
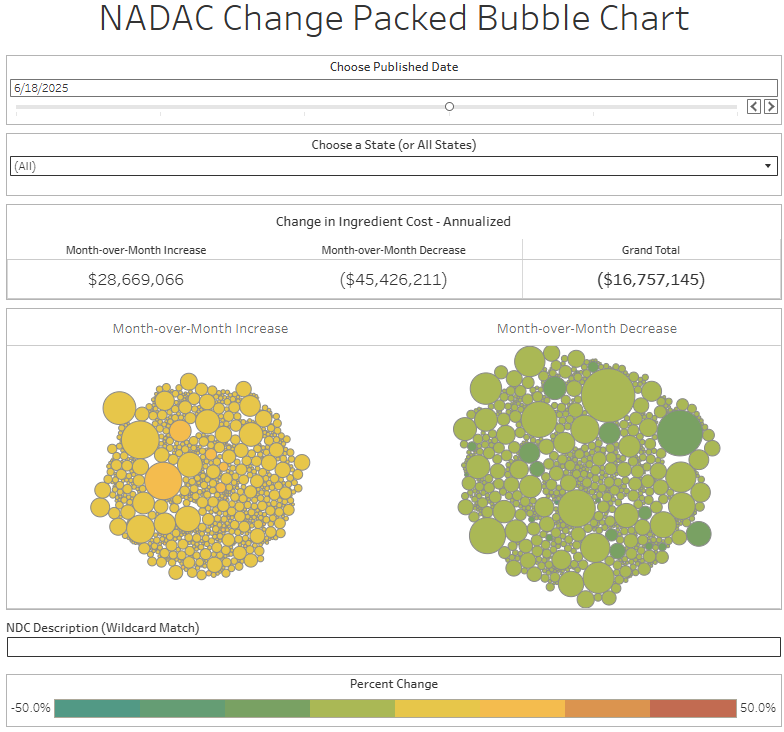
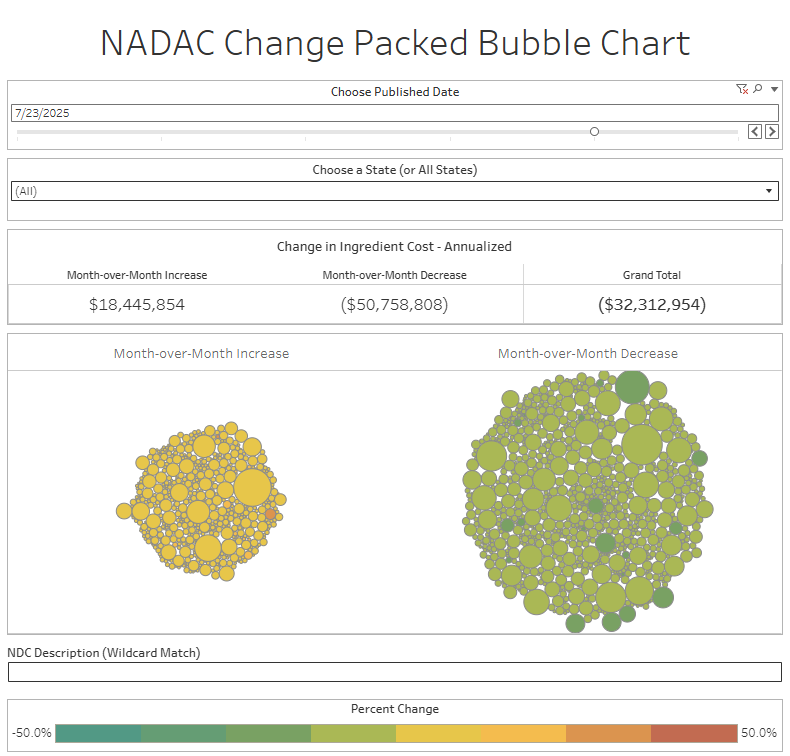
Overall, in April, there was $26 million worth of inflationary drugs, with an offset of $46 million of deflationary generic drugs, netting out to approximately $20 million of generic drug cost deflation for Medicaid. In May, there was $26 million inflationary drugs, with an offset of $40 million in deflationary generic drugs, netting out to approximately $14 million of generic drug deflation for Medicaid. In June, the numbers were $29 million inflation and $45 million deflation, for a net of approximately $17 million of generic drug deflation for Medicaid. And finally in July, there was just $18 million in generic drug inflation and $51 million in generic drug deflation, for a net of $32 million in generic drug deflation for Medicaid. In other words, it didn’t really matter which month we looked at; things were generally getting meaningfully cheaper in the generic space.
Now, despite these monthly observations, the next thing we do when it comes to monitoring generic drug prices is to assess year-over-year trends (YoY), and those are telling a different story from our monthly observations.
6. Year-over-year generic oral solid activity is not deflationary — but inflationary — for the first time
Ever since June 2020, we have been tracking year-over-year (YoY) NADAC changes for all generic drugs that have a NADAC price. We once again weight all price changes using Medicaid’s drug utilization data. These past few months, April to July, have shown YoY behavior that we have not seen before. Now, we do think that we should reasonably expect to see some meaningful differences in April to July 2025 relative to other time periods, because if you recall, the April to July 2024 period was a time of significant NADAC swings.
Now, a year later, as we measure where NADAC is today vs. where NADAC was a year ago, we’re going to face a variety of “tough comps” due to the base effect phenomenon. In other words, in April 2024 to July 2024 we were talking about significant NADAC swings that were causing NADAC to be, in general, much lower than over any other recent timeframe. As we make comparisons of the current times against those past times, we should expect those comparisons to look a little funky. Furthermore, we should recognize that the methods used to calculate NADAC are different today than they were a year ago. Anyway, without further caveat, here is what our YoY data is showing us for NADAC changes over time.

Figure 5
Source: Data.Medicaid.gov, 46brooklyn Research
In April, the YoY NADAC price changes on oral solid generics and all generics was at +4.6% and +3.4%, respectively. This was the first time we’ve observed inflation on the year-over-year measure, so we decided to investigate these trends in a companion report rather than lengthen what is supposed to be a quick read. If you’re interested in reading up on our thoughts on NADAC, particularly over time, read more here
In May, the YoY NADAC price changes on oral solid generics and all generics was at +8.4% and +6.0%, respectively. In June, the YoY NADAC price changes on oral solid generics and all generics was at -5.2% and -5.7%, respectively. In July, the YoY NADAC price changes on oral solid generics and all generics was at +9.1% and +6.9%, respectively. Now, while the YoY NADAC has been kind of a wild ride over the last few months, if we had to guess what the future holds, we’d assume that August will look more ‘normal’ in terms of our YoY measure, as the effects of the April to July 2024 are no longer as influential to our comparison. But only time will really tell what that all looks like.
That’s all for this quick-ish catch up. Come back to 46brooklyn next month as we look to get back on track for our monthly drug pricing updates.
It’s been awhile, so some quick shout-outs for some good 46brooklyn press coverage from the spring/summer:
Behind the PBM curtain: Antonio Ciaccia exposes the game
RealPharma, 7/28/25
Why CVS stopped sharing sales data on its leading Humira biosimilar
Endpoints News, 7/22/25
BMS/Pfizer offer direct-to-consumer option for Eliquis
Managed Healthcare Executive, 7/17/25
Direct-to-patient apixaban program aims to expand access, lower out-of-pocket costs
American Journal of Managed Care, 7/17/25
Podcast: The PBM Hitman
Organized Money, 7/15/25
Insurers’ pledge to reduce prior authorization may be ‘major shift’ or ‘dog and pony show’
Healio, 7/11/25
What options do retail pharmacies have to become profitable?
AIS Health, 7/3/25
340B could have a new cop on the beat. Hospitals are worried.
Healthcare Dive, 7/2/25
Antonio Ciaccia’s remarks to the Ohio Joint Medicaid Oversight Committee
Ohio Channel, 6/26/25
What’s next for retail pharmacy: Data, debate, and disruption
Drug Channels, 6/20/25
Ohio-based hospital chain said to profiteer from massive charity-care program
Ohio Capital Journal, 6/18/25
Trump drug price plan risks fallout for Medicaid, beneficiaries
Bloomberg Law, 6/9/25
Case study of attempts at drug-pricing reforms in Ohio shows promise and peril for the Trump administration and Congress
Health Care un-covered, 6/9/25
PBMs fight back as state seeks stronger regulation
Modern Healthcare, 6/9/25
Ohio’s Cleveland Clinic faces questions over booming subsidies
Ohio Capital Journal, 5/30/25
Q&A: How pressure in the marketplace could enforce PBM reform
Drug Topics, 5/26/25
Q&A: How PBM practices were uncovered in the Ohio Medicaid program
Drug Topics, 5/25/25
FDA announces efforts to facilitate drug importation from Canada
Endpoints News, 5/21/25
Trump’s order on drug prices isn’t what it seems
MSNBC, 5/13/25
Trump signs drug price executive order. What does it say?
USA Today, 5/12/25
Demystifying PBMs, their role in the drug supply chain
Drug Topics, 5/8/25
Misconceptions surrounding the frictional PBM-pharmacist relationship
Drug Topics, 5/2/25
How PBMs gained notoriety in the prescription drug market
Drug Topics, 4/30/25
Is taking fewer medications the key to lowering drug costs in the U.S.?
NBC News, 4/30/25
The 3 types of PBM reform aiming to change the pharmaceutical market
Drug Topics, 4/28/25
Cassidy urges congressional reforms to 340B drug discount program after investigation
Endpoints News, 4/24/25
An ‘insane’ calculus: A pharma company raised price for a rare disease drug 150% to cover Medicaid rebates
STAT News, 4/22/25