
Are generic drug prices going up or down? Depends on which benchmark you ask
For the first time: Year-over-year generic drug price inflation
For those unfamiliar, our team at 46brooklyn Research have a thing for tracking prescription drug prices. Not just the prices of drugs, but perhaps more interestingly, we track the multitude of different prices of drugs. If that sounds like the same thing, it isn’t. See, perhaps the most fascinating thing about prescription drug prices – especially in the U.S. – is the fact that a single drug can yield an dizzying number of prices at any stage of of its flow through the drug distribution channel. Hell, even in just one government program, a single drug could yield thousands of different prices just at the pharmacy counter. And it’s not just the number of different prices, it’s the sheer range of prices that can stretch the human mind well beyond rational comprehension (our first report at 46brooklyn highlighted this issue with the popular leukemia medication imatinib mesylate, where different state Medicaid programs were paying as low as $108.60 per pill and as high as $295.70 per pill, all at the same time).
As a result of this asymmetry of drug pricing realities, we spend ample time researching all the different ways that price can be effectuated in an effort to land at truth.
We’ve been saying it for years: drug pricing is complicated. We’re not alone. Every researcher and policy wonk that we can think of says it too.
But of course, the mere existence of a plethora of drug pricing benchmarks raises obvious questions about drug pricing’s true nature. As he mentioned during his remarks to Ohio’s Joint Medicaid Oversight Committee in June, our own Antonio Ciaccia explained how the mere existence of so many benchmarks that attempt to quantify the price of a drug is in essence an indicator that arriving at the actual real underlying cost of a drug is a constant moving target in a jungle of lies.
So, does that mean that all drug pricing benchmarks are bad? Do they exist just so drug channel participants can define reality on their own terms or so that we can fund piles of academic research that use those benchmarks in an endless hamster wheel of “I guess we’ll never really know?” Or is that each benchmark has its own flaws and utility? Maybe not all benchmarks are created equal. Maybe by understanding each benchmark’s true essence, we can better surround drug pricing truth.
While it can be easy to get lost in all the nuances and takeaways that each benchmark can emit, the truth is that, for many people, the only price that matters is the price that they have to pay. It’s hard to argue with that. But perhaps the next most interesting thing is to compare what is paid relative the underlying cost of the drug. The cost of a drug combined with any markups on the drug ultimately comprise the entirety of a prescription drug transaction. Thus, tracking both drug costs and markups are integral in the determination of what may be driving drug spending realities.
To that end, every month, we review the recent changes in brand drug list prices (wholesale acquisition cost [WAC]; manufacturer sticker prices) and generic drug acquisition costs (national average drug acquisition cost [NADAC]; the prices pharmacies pay to purchase drugs).
And with in those monthly data pulls, ever since June 2020, we have also been tracking year-over-year (YoY) deflation for all generic drugs that have a NADAC price. As a reminder of what that process look like we:
Download NADAC prices for all National Drug Codes (NDCs) in the month (“n”) and the same month in the prior year (“n-1”). Eliminate all NDCs that do not have NADAC prices available in both periods and break out NDCs by whether or not they’re oral solids (i.e., tablets/ capsules) or not.
Multiply monthly NADAC unit costs by total Medicaid “units reimbursed” (from CMS State Drug Utilization Data) in the prior calendar year period. For example, to size April 2024 changes, multiply by total 2023 Medicaid units reimbursed. To size March 2023 deflation, multiply by total 2022 Medicaid units reimbursed. To size November 2017 deflation, multiply by total 2016 Medicaid units reimbursed. You get it.
Add up all cost in period n-1. Add up all cost in period n. Subtract the latter from the former. That’s the total dollar deflation. Divide total dollar deflation by n-1 cost. That’s the percent deflation.
We started doing this five years ago because of a Pew Charitable Trust piece on generic approvals and competition. However, it became something that we incorporated into our monthly reports, as it let us gain additional insights into generic drug prices in a manner different from our single drug or month-to-month evaluations. In fact, in many other areas, monitoring YoY changes is the more common approach as opposed to month-over-month (MoM). Consider the attention that annual inflation gets. We measure inflation on an annual basis in part to avoid seasonality (e.g., heating bills look much different when a winter month is compared to spring, but less so when this December is compared to last December), but also because YoY is best for judging whether inflation is on target over the long haul, anchoring expectations, and communicating with the wider public.
We have seen, and come to expect, that when we measure generic NADAC changes YoY, we will see deflation (that is declining prices relative to last year). We’ve come to expect that, because it is what we’ve seen for the entirety of the five years we’ve been running the numbers; that is until April 2025. In April 2025, we observed for the first time YoY generic inflation – not deflation. See Figure 1:
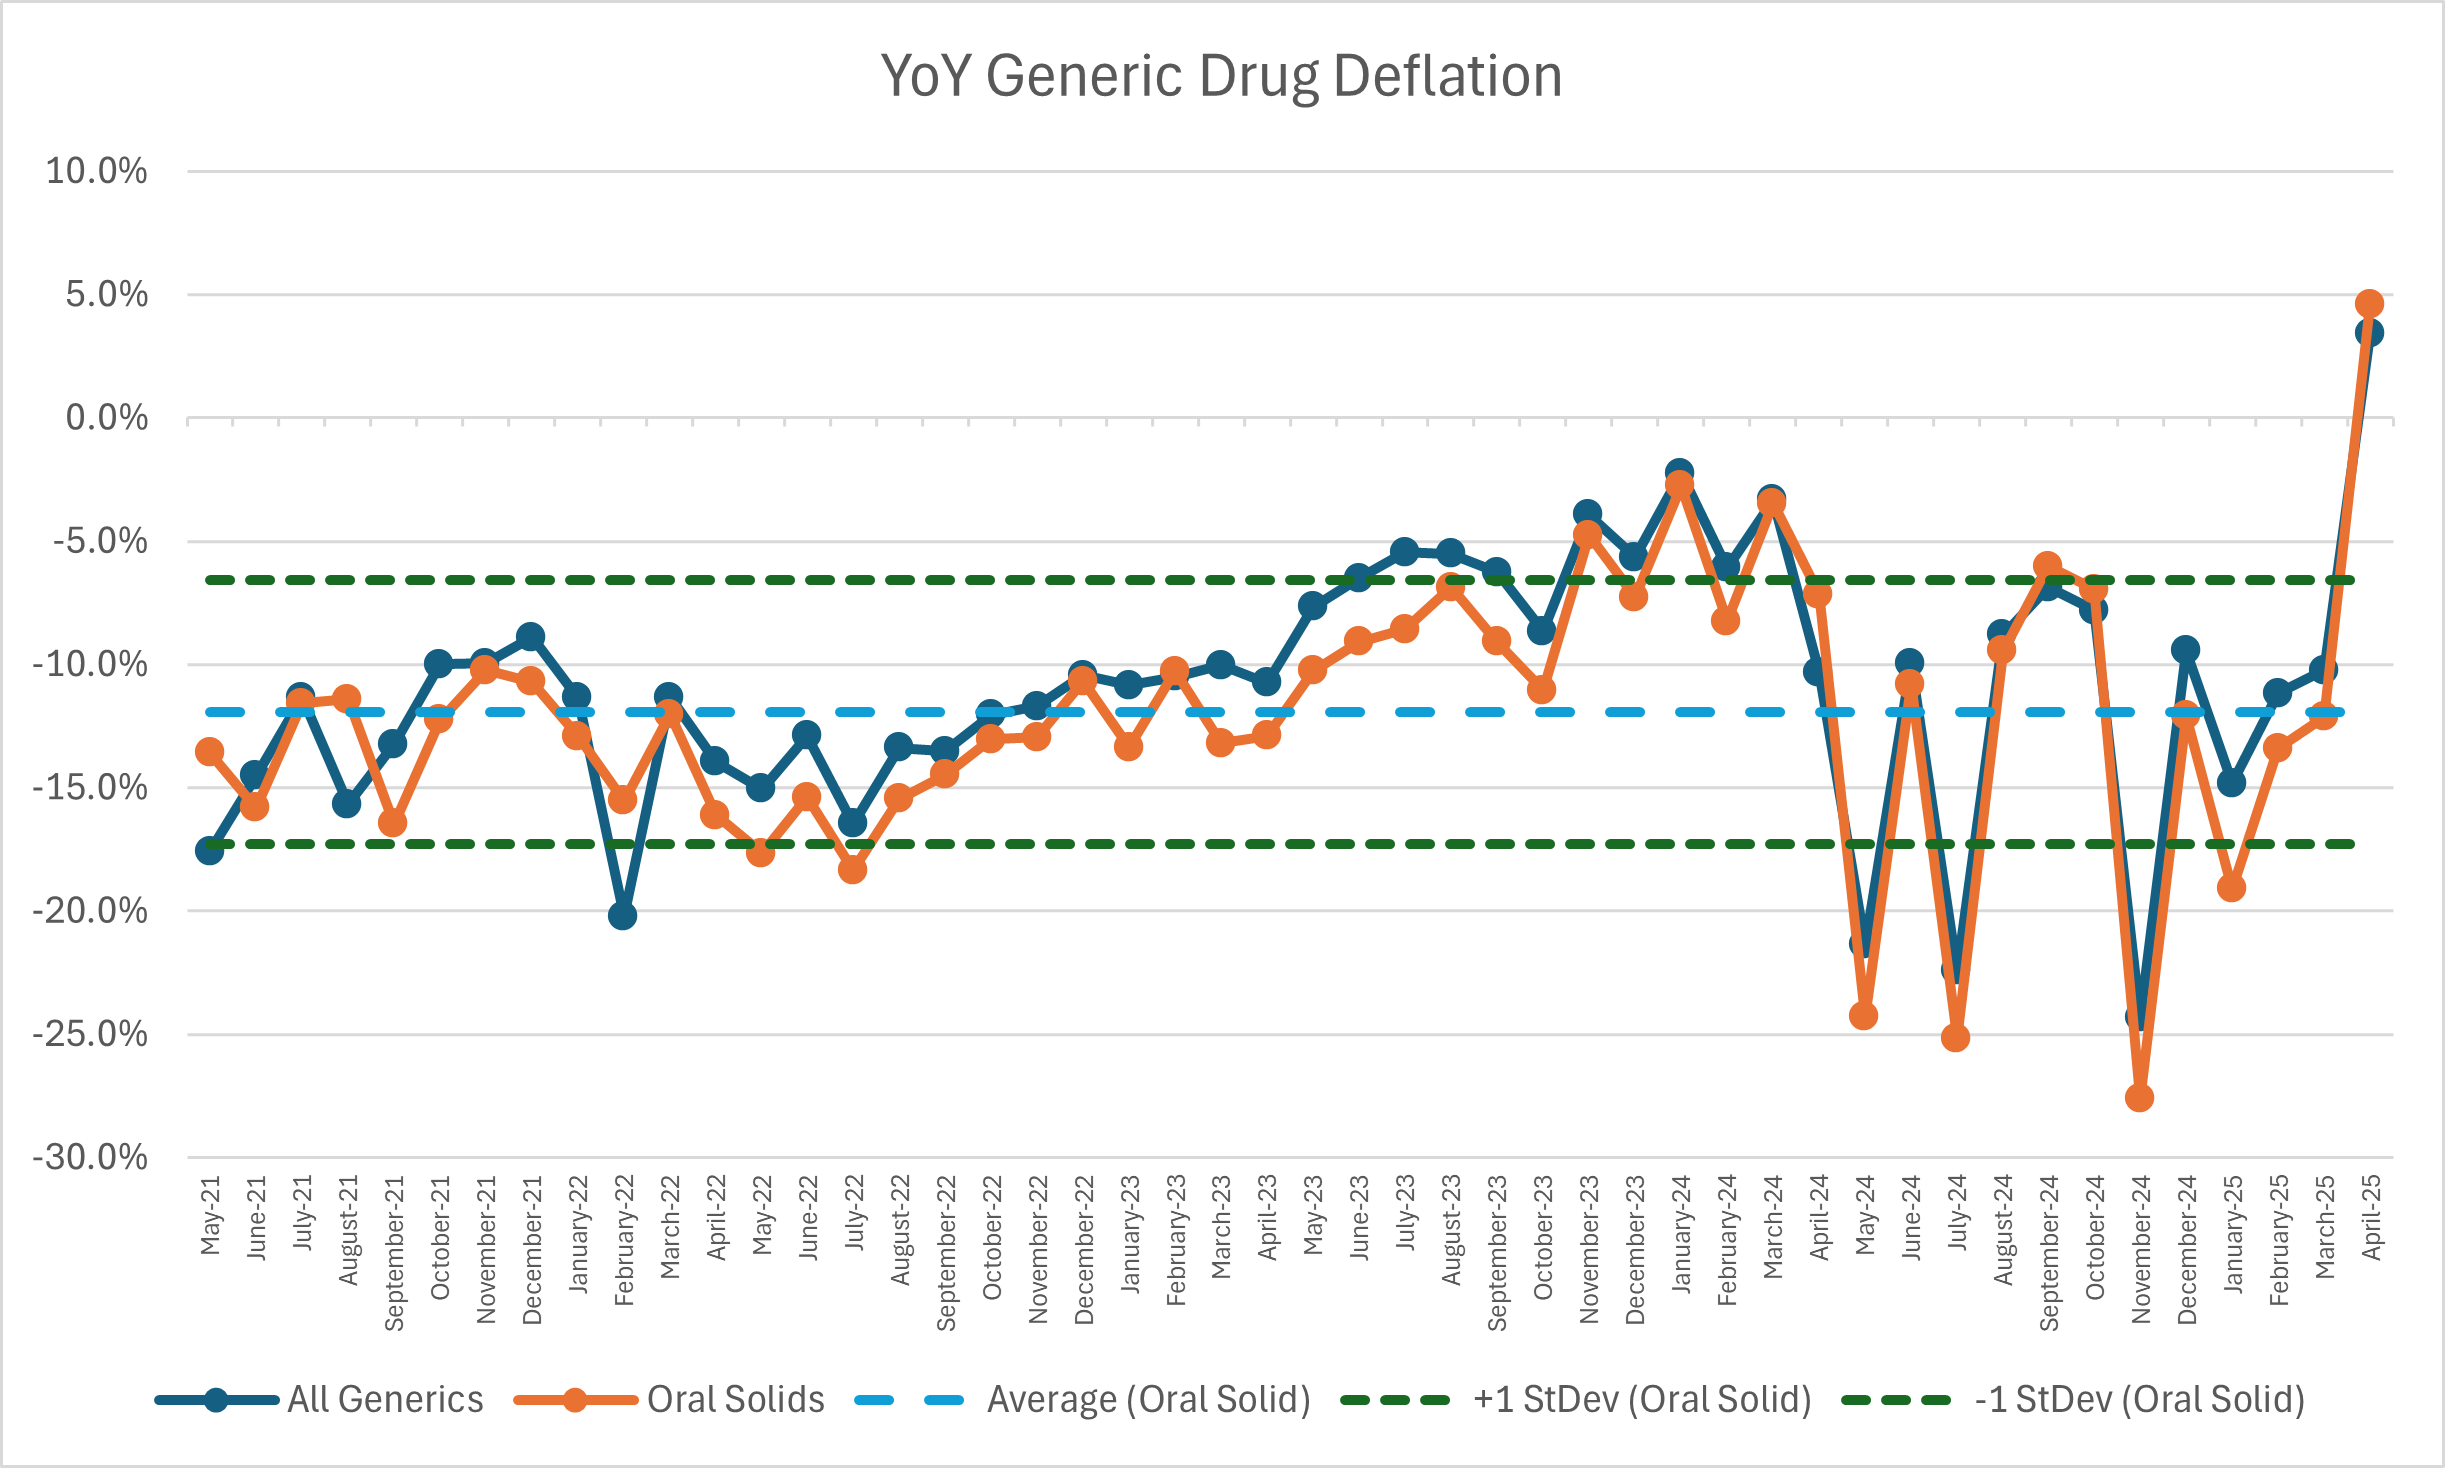
Figure 1
Source: Data.Medicaid.gov, 46brooklyn Research
So while YoY NADAC trends have historically told us that it was cheaper to buy a generic drug today than a year ago, for April 2025, it is actually telling us that it was cheaper to buy a generic drug a year ago. Given that this is the first time we’ve seen YoY generic inflation, we thought it was worth a closer look at NADAC.
April 2024 to April 2025: What happened?
There were a few ways we approached trying to understand Figure 1. First, was checking our work. Mistakes happen in data analysis all the time, but we usually catch them before release, and so it seemed worthwhile to be sure the data supported what Figure 1 showed us. Although we always give our best efforts, we spent a good amount of time QAing this monthly report and kept getting the same answer – YoY NADAC was inflationary; not deflationary. So once we were sure our observation was correct, our next step was trying to understand why.
Our first approach was to mirror what we do in our monthly reports where we compare unweighted MoM changes for NADAC, but modified it to compare unweighted YoY changes to NADAC. In Figure 2, we compare the NADAC price in April 2024 to April 2025 on an unweighted basis to see what the unweighted view show us. As can be seen in Figure 2, the unweighted view seems to be preparing us to see generic drug inflation, as on an unweighted basis, a bunch more products appear to have been higher in April 2025 compared to April 2024.
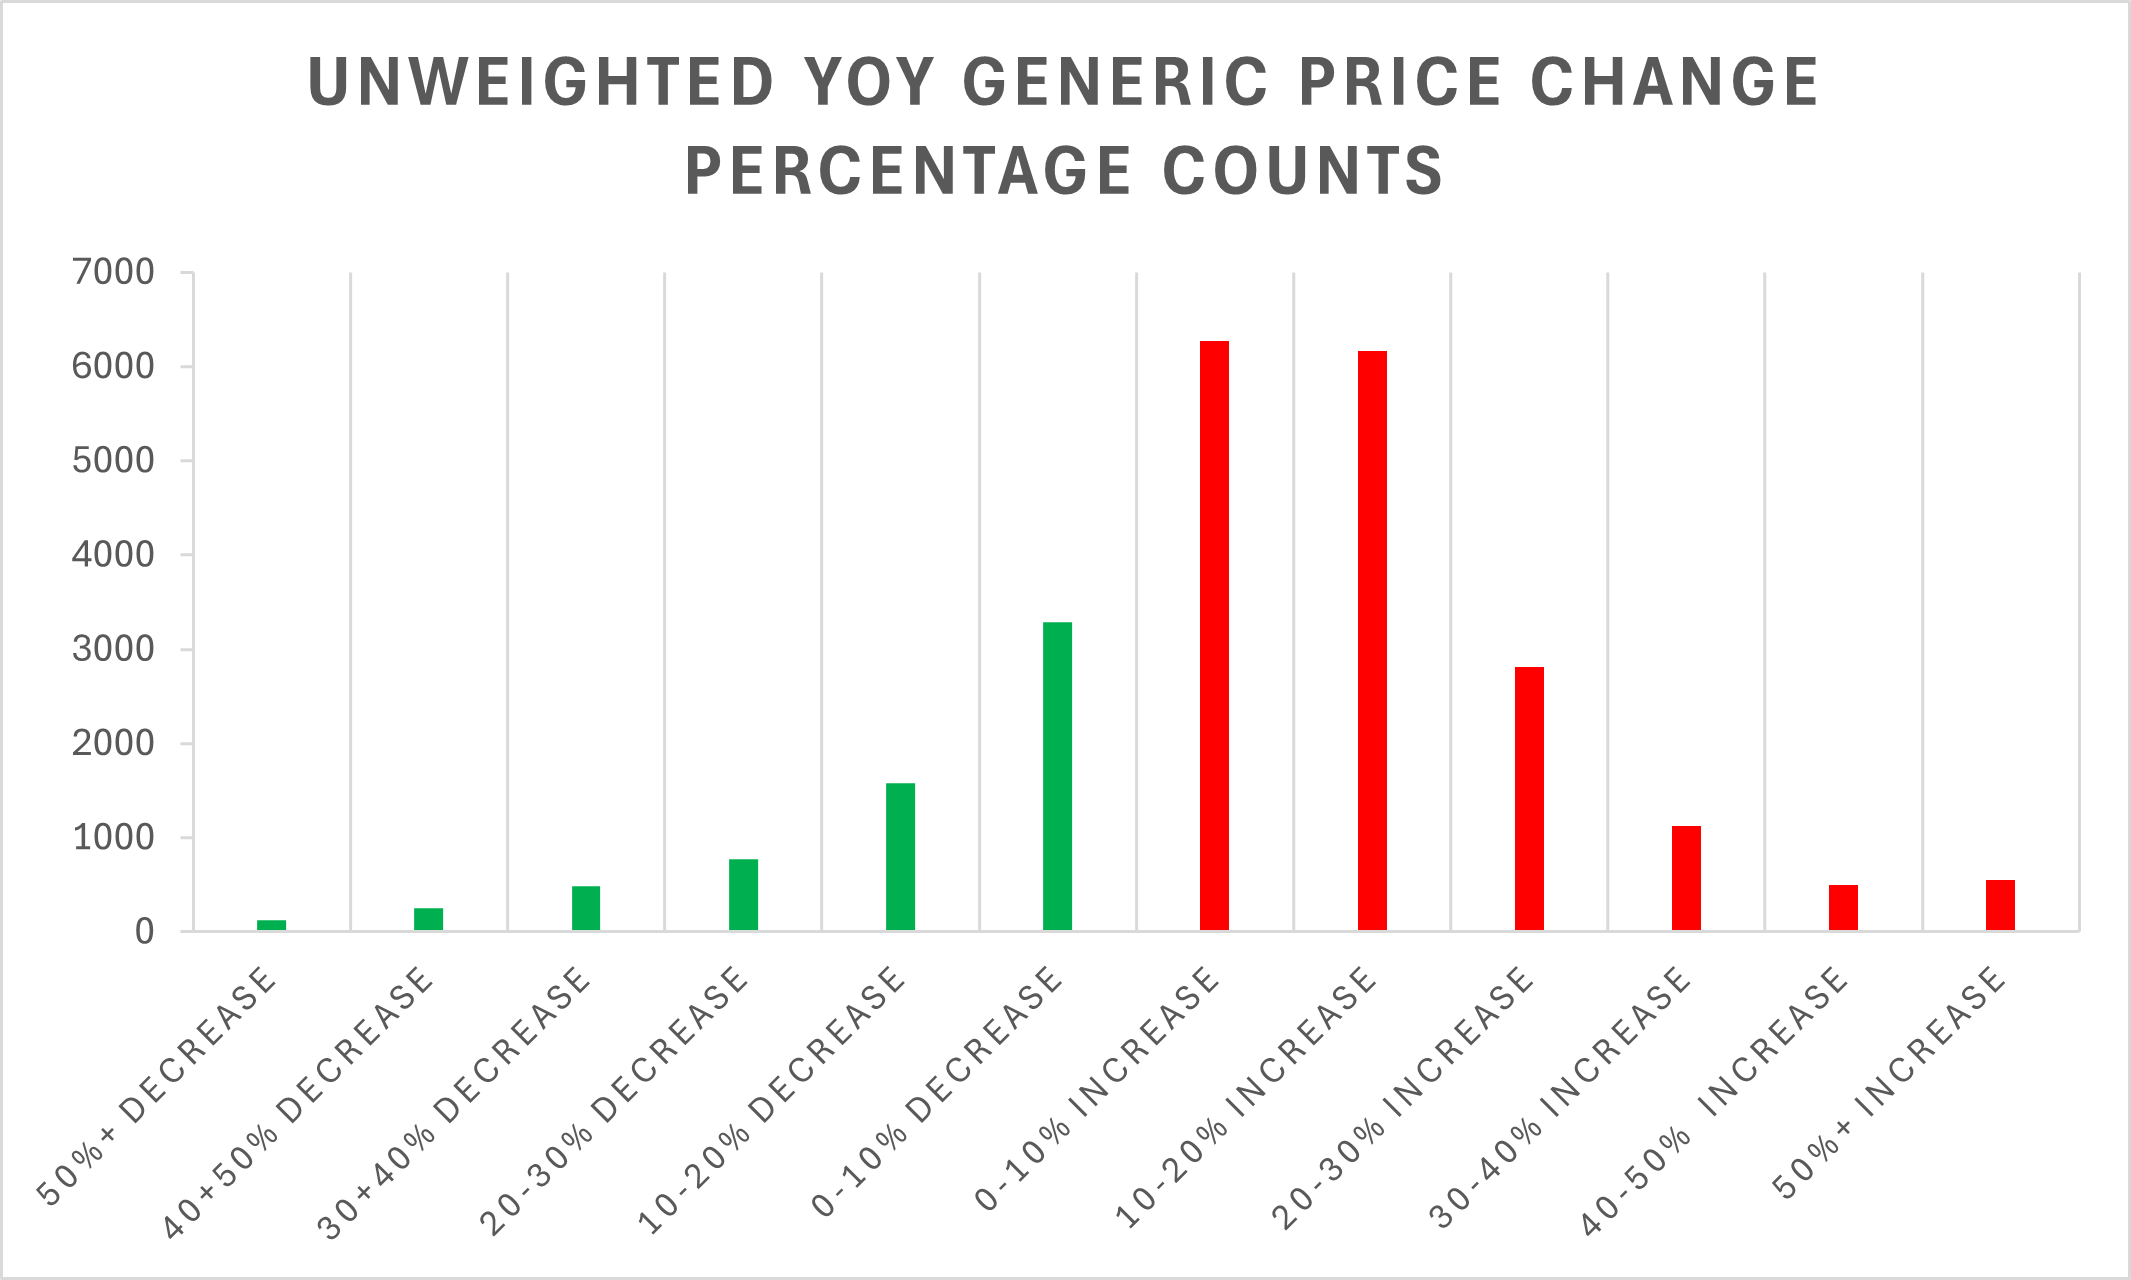
Figure 2
Source: Data.Medicaid.gov, 46brooklyn Research
As can be seen in Figure 2, many more NDCs say YoY price increases (tall red bars) relative to decreases (smaller green bars). In fact, for every product that decreased in price YoY, there were 2.67 products that saw a price increase. But, as we always caution that an unweighted view of pricing doesn’t tell us if the things that really matter moved up or down in meaningful ways. For example, a manufacturer could launch a new generic atorvastatin, the most commonly dispensed drug, at a $1,000,000 per pill if they wanted to (let’s say it’s a list price, and they’re offering a 99% discount). Undoubtedly, the launch of this product would potentially pull the unweighted average list price of atorvastatin (generic Lipitor) up quite a bit (given all the existing formulations being no more expensive than $11 per pill on a list price basis in May 2025). However, if no one buys that super expensive version (and they shouldn’t), it won’t influence more meaningful measures of drug pricing, like NADAC (which reflects invoice purchase prices by pharmacies). The point being is that while Figure 2 helps us begin to explain Figure 1, it doesn’t really tell us all that much. So, in a less abstract way, let’s compare some of the movers and shakers from our YoY NADAC price increase.
To start, we add in Medicaid utilization onto the NDCs for our April-to-April comparison. We did this because Medicaid 2023 is the last full year of Medicaid utilization data we had at the time of this analysis. When we add in Medicaid data, we begin by acknowledging the generic drugs (that have a NADAC price) we’re studying in Figure 1 represent 83% of all prescriptions dispensed in 2023 (650,706,132 out of a total 781,680,928 prescriptions). This makes sense, as most drugs dispensed are generics, and NADAC prices are available for nearly all generic drugs. However, we must also acknowledge that the NDCs we’re studying cover just 13% of 2023 gross Medicaid expenditures ($14 billion out of $106.4 billion). When we evaluate utilization and expenditures for the drugs on whether they increased or decreased YoY on NADAC, we see that 82% of prescriptions evaluated (530,653,855 out of 650,706,132) saw a YoY NADAC increase (Figure 3). The remaining 18% saw a no change or a decrease.
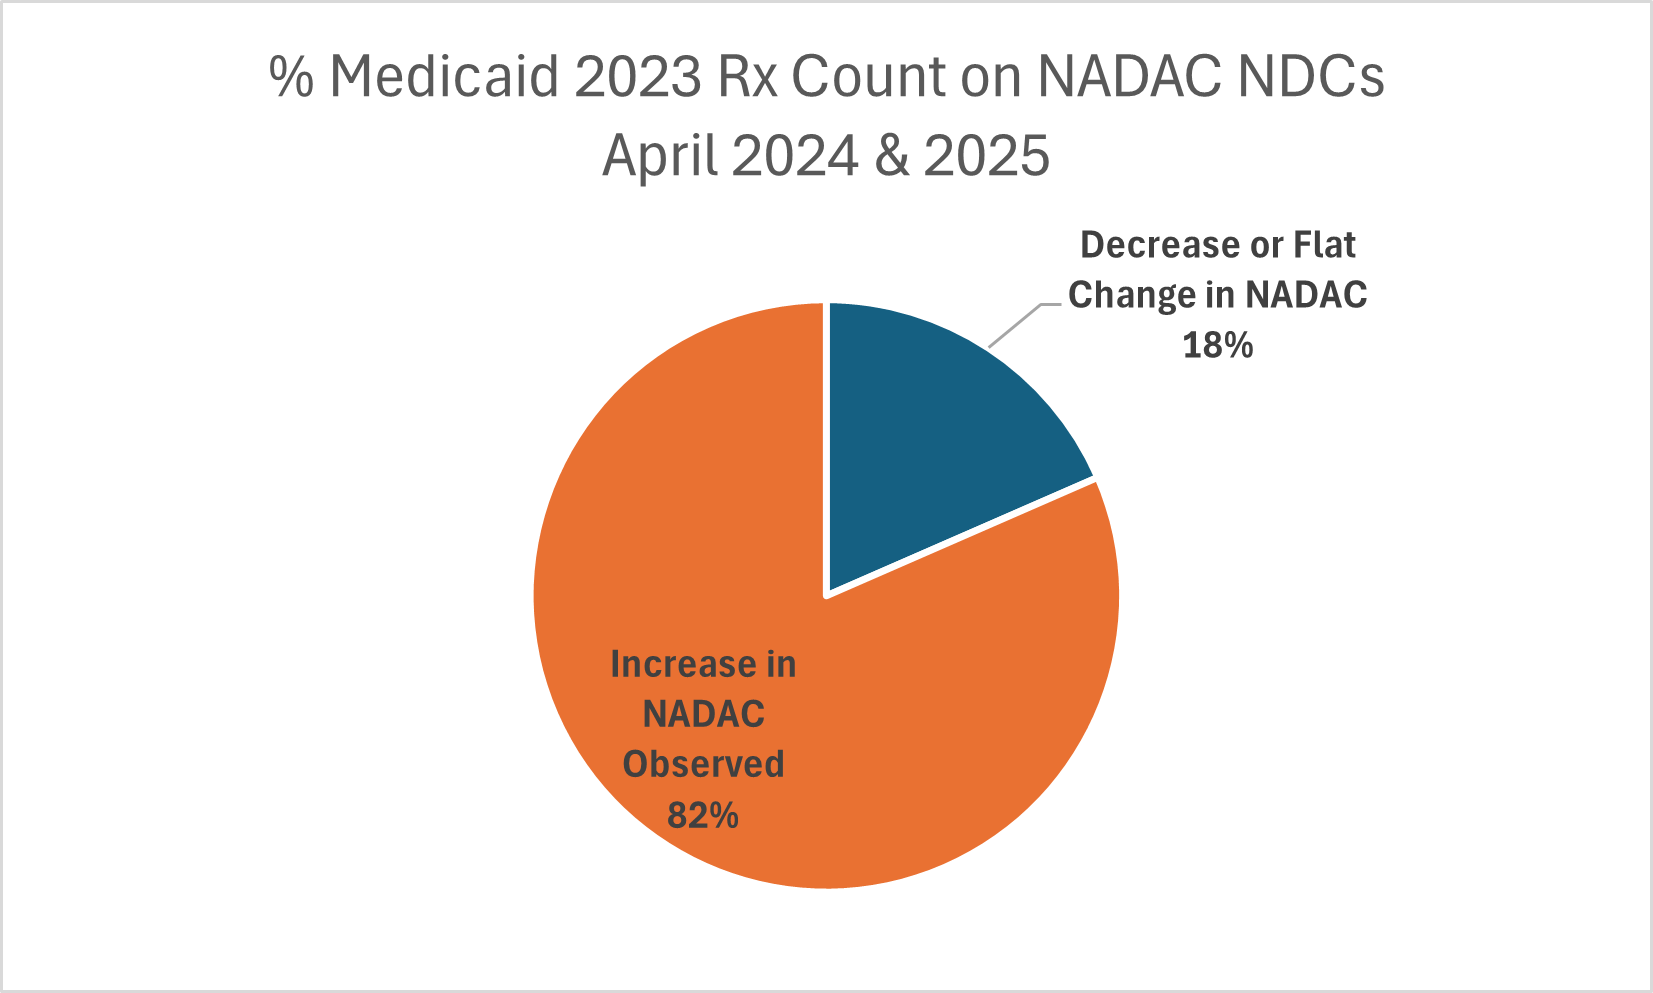
Figure 3
Source: Data.Medicaid.gov, 46brooklyn Research
However, when we look at Medicaid expenditures, 64% of the Medicaid 2023 expenditures ($9 billion out of $14 billion) were on NDCs that saw an increase (Figure 4).
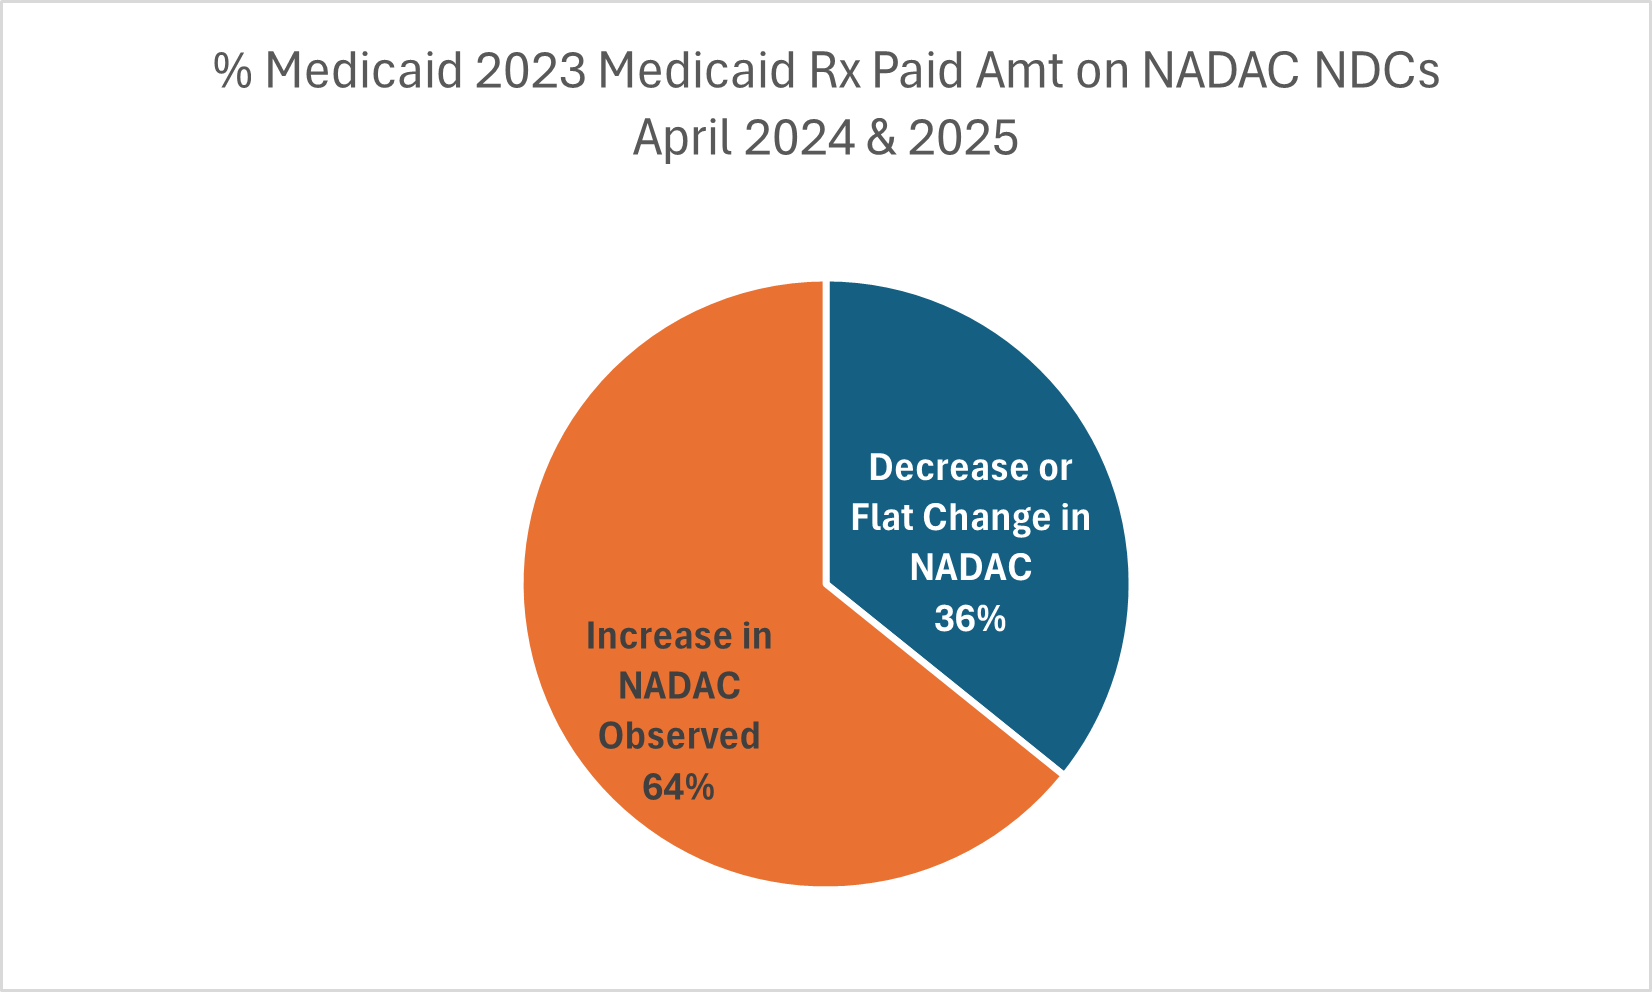
Figure 4
Source: Data.Medicaid.gov, 46brooklyn Research
So what is going on? Well, some of the most utilized generic drugs are really cheap and seeing relatively small numerical price increases, but on a percentage basis, the small increase on an already small product can be a big increase. For example, consider simple acetaminophen tablets 325 mg. These tablets went from $2.22 per 100-count bottle on a NADAC basis in April 2024 to $2.54 in April 2025 for that same bottle. That $0.32 increase doesn’t really make the bottle more or less affordable (what’s effectively a quarter worth nowadays), but it does demonstrate a 14% price increase YoY (Figure 5).
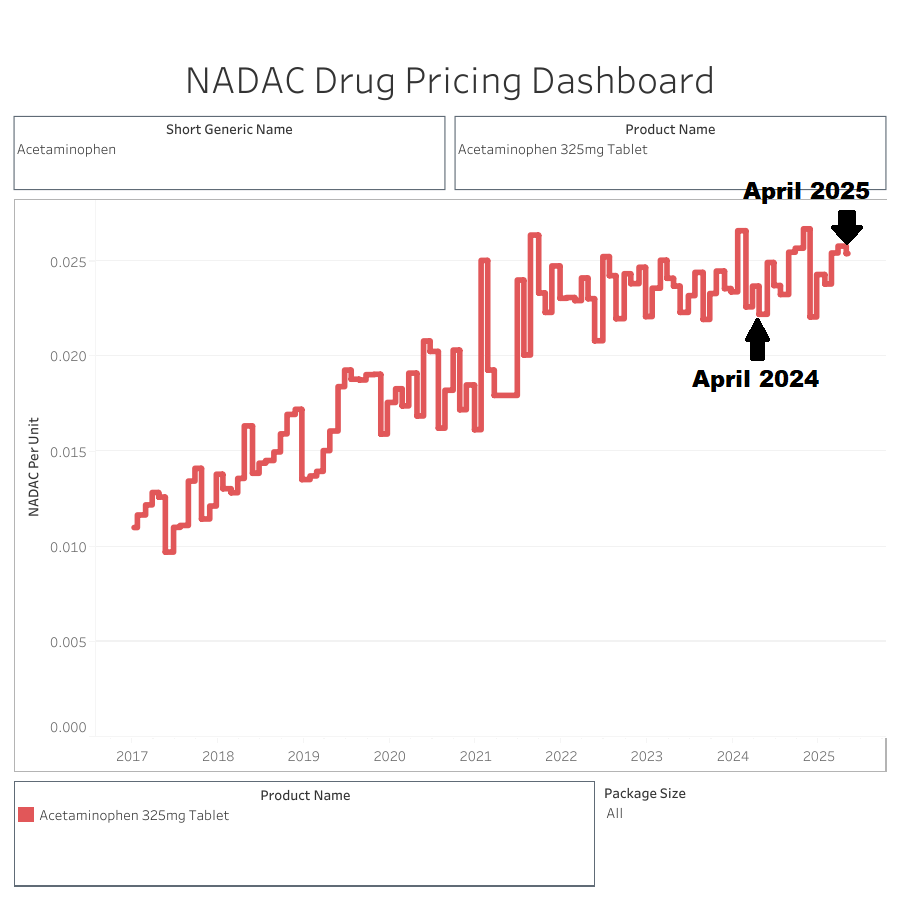
Figure 5
Source: Data.Medicaid.gov, 46brooklyn Research
So a small increase on an already small number can be a big percentage increase, which is part of what we’re observing here. Going back to the Medicaid 2023 (see Figure 6 below), the average NADAC price per prescription (units dispensed multiplied by NADAC price) in April 2024 for products that saw an increase was $7.19. These products in April 2025 now have an average NADAC price $8.29 (or an increase of 15%; $1.10 per Rx on average). However, these are being offset by the products that are decreasing in price, which are generally more expensive generic products. For example, on the products that saw a YoY decrease in price, the average NADAC price per prescription in April 2024 was $27.39 but declined to $24.25 in April 2025 (a decrease of 11% YoY; $2.93 per Rx on average). However, as we saw in Figure 3, the increase bucket represents approximately 4.5 times more utilization than the decrease bucket. As a result, they pull prices up more than the decreases can pull down. We put it all together in Figure 6.

Figure 6
Source: Data.Medicaid.gov, 46brooklyn Research
Here, we can see a couple things:
Generic drugs are generally cheap (as demonstrated by an average NADAC per Rx of approximately $11 or an average Medicaid payment per Rx of approximately $20 per Rx). As a result, a 3% increase in generic NADAC costs from April 2024 to April 2025 means that what previously was $10.92 is now $11.27; or $0.36 more expensive per prescription (can you break a dollar?).
Not all generic drugs are created equal. Many prescriptions have an average NADAC value below $1 per prescription, whereas there are some that have an average NADAC value of over $1,000 per prescription. Fortunately, most generic drugs are cheap (like $10 or less on a NADAC basis), but it does mean that even small price changes (i.e., $0.01) can be proportionally large.
In general, the more expensive generic drugs are getting less expensive over time; however, the cheap ones outnumber the more expensive ones such that it may not be readily apparent when we look at price trends at the highest level.
While the above helps us contextualize what happened from April 2024 to April 2025, it doesn’t necessarily tell us much about why our observations were what they were or what we may expect on the horizon. In order to make better sense of what is going with YoY NADAC changes, we’re going to take a brief side bar to discuss attempts to understand broader rates of inflation over the last year.
What does the idea of a ‘tough comp’ mean?
When financial analysts talk about a “tough comp,” they are really talking about the base‐effect problem — the way an abnormally low (or high) price in the prior period can make today’s year-over-year (YoY) growth rate look exaggerated. Consider gasoline prices as an example. During the COVID-19 pandemic, gasoline prices declined (you may recall there was so much oil that there was nowhere to put it, and in mid-April 2020 the price of a barrel of West Texas crude went below $0 as sellers had to pay get rid of it). Not to bring us back to those dark days, but undoubtedly a year later in April 2021, when we were looking at gas prices that were no longer free, it looked like they were a lot more expensive than what a MoM view of gas prices might have shown us in April 2021. While 46brooklyn is not a hub for education about macroeconomics, such blogs do exist (for example, we know a very familiar face at Bancreek), which can do a much better job than we can in explaining this base-effect problem than we can. For example, in their April 2025 blog, Bancreek reminded readers that headline inflation was flattered by the fact that gasoline prices had “rolled off” a depressed base set during the prior spring’s oil-market swoon.
The point being that the same mindset the financial analysts use in monitoring economic data can be invaluable in our drug-price surveillance monitoring. Prescription-drug categories can post huge YoY or MoM swings that have little to do with fundamentals: a blockbuster loses exclusivity or a shortage pushes generic prices sky-high. We’ve written about what happens to drug prices when patents expire or during shortages, but haven’t really joined the individual observations into the broader concept of base-effect problems. An oversight perhaps on our part, but one that is worth including now given that we have no doubt there will be those that digest Figure 1 in this report and hold it up as evidence that NADAC is broken. However, we do not think that is what Figure 1 demonstrates.
Rather, we think it demonstrates a need to keep in mind that part of what we’re assessing with YoY changes can be influenced by unique factors that existed a year ago that may or may not be as relevant today as they were then (see earlier gasoline example). For NADAC, we think that the base-effect we need to keep in mind is that NADAC underwent a great deal of volatility starting in April 2024 – volatility that we previously discussed. It seems that some larger purchasers of generic drugs started providing data into NADAC, whereas before, they had not. They appeared to have done so in a whipsaw way – doing a metaphorical hokey pokey with their data submissions – which led to several months of NADAC swinging up and down quite a bit. Ultimately, the changes in NADAC based upon who was and wasn’t participating in the survey led CMS to update NADAC methodology to ‘smooth’ observations over time. This means that when we look at YoY NADAC observations, we’re looking at a period where NADAC has a ‘tough comp’ due to atypical participation in the survey at the time we are basing our comparison analysis upon, not necessarily the survey itself.
Could NADAC be improved? Without question. Would improving NADAC, such as mandating participation in the survey, help produce additional savings on generic drugs or smooth out the NADAC observations MoM and YoY? Probably. In fact, we can probably use some other pricing benchmarks to demonstrate why this is the case.
What can other drug pricing benchmarks teach us about attempts to quantify generic drug prices?
As we stated in the intro, NADAC isn’t the only way we can contextualize drug prices. So maybe we can use some of the other drug pricing benchmarks to help contextualize what is perhaps happening with NADAC. We selected the grandy of them all, the oldest drug pricing benchmark – Average Wholesale Price (AWP) as our measuring stick. AWP is the price benchmark that is pretty much the dominant way drug prices are determined in pharmacy benefit contracts (be they payer or provider level), and we guess that if you’re reading this report, you’re already familiar with AWP.
Average Wholesale Price (AWP)
While it technically stands for average wholesale price, seasoned pharmacy veterans have often sarcastically referred to it as “ain’t what’s paid.” We’ve always preferred “always what’s profitable.” In Figure 7 below, for each generic NDC in the NADAC database, we calculate the end price of each at the end of each quarter from Q1 2020 to Q2 2025 (this roughly approximates our YoY NADAC trend timeline). In other words, to determine the price of an NDC in Q1 2020, we capture the price as it was effective on 3/31/2020 for both AWP & NADAC. We then trend the expenditures of AWP and NADAC using CMS state drug utilization data (SDUD) 2024 average quarterly utilization (number of units, number of prescriptions), as it is the last full year of data we have available from SDUD. As can be seen, AWP and NADAC trends are moving in opposite directions.
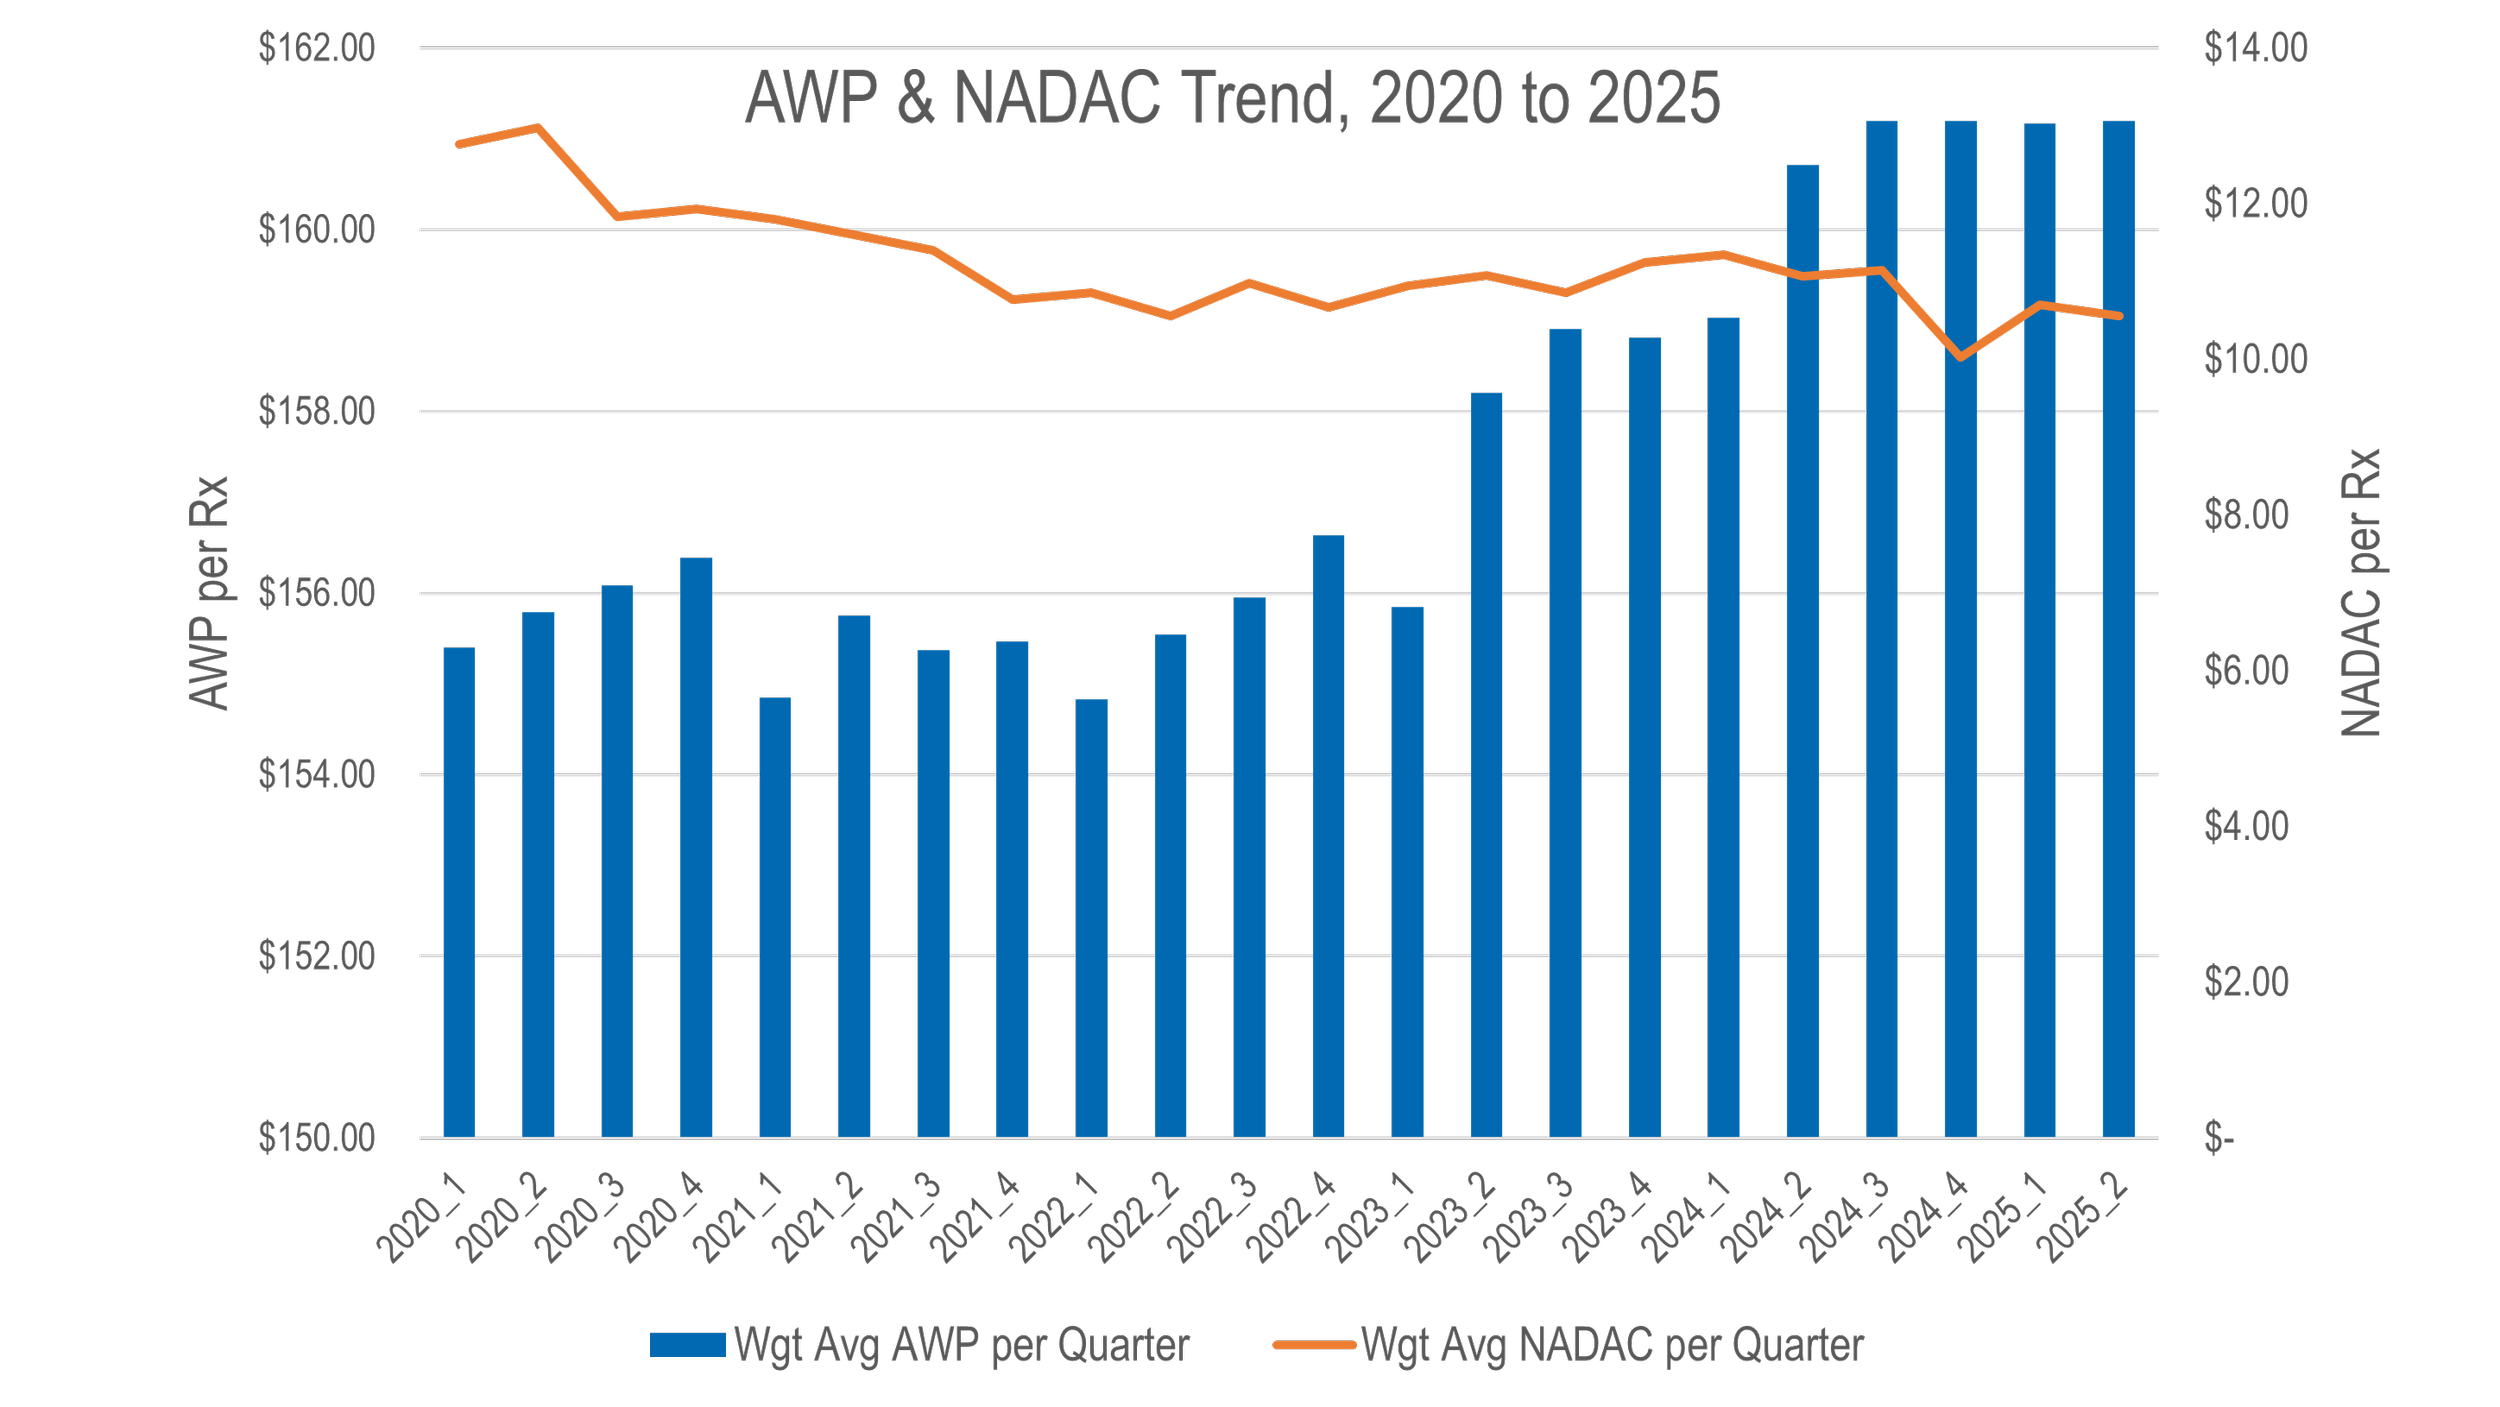
Figure 7
Source: Data.Medicaid.gov, Elsevier, 46brooklyn Research
Based upon the results in Figure 7, from Q1 2020 to Q2 2025, the generic AWP value increased 4% whereas the NADAC value decreased 17%. Note, the figure above uses two-differently scaled y-axis so that trends can be seen but it shouldn’t be lost on us that at the start there’s an over $100 difference between the AWP-value of a drug and it’s underlying NADAC. If you ever wondered why generic drugs are discount at 85%+ to AWP for generic drugs, the answer is right there in the axis of the figure above. What’s more is that if we calculate an ‘effective-rate’ value for NADAC relative to AWP (that is the NADAC-equivalent AWP discount), we observe from 2020 to 2025, the generic NADAC-to-AWP discount has increased 1.7% (2020: NADAC equivalent to AWP – 91.8%; 2025: NADAC equivalent to AWP – 93.4%). For those who say NADAC is too volatile or unreliable to price drugs, this data should be strongly considered as context, given that AWP-based pricing remains a legacy PBM industry standard. In other words, if the market is trending downwards, as NADAC suggest, do you want to be tied to a benchmark that is trending upwards, as AWP would suggest?
All else being equal, if you secured an effective rate discount of say AWP – 85% for generic drugs, the data over time is showing us that year-over-year, your pricing for generic drugs would have gotten worse as a function of rising AWP-based costs – especially when considering those prices going up when the underlying costs of those drugs were going down. Unless you’re able to secure a new discount each year, and unless that discount keeps up with the growing disconnect between AWP and NADAC, you’re AWP-based pricing gets worse over time, not better. Conversely, if your payment was tied to NADAC, and to the extent that NADAC better approximates real pharmacy acquisition costs, you would have seen prices decline without ever having to renegotiate your contract. In other words, the realities yielded from a competitive market would have lowered your prices by 17% on a NADAC-basis whereas your AWP-based discount would need constant tending and monitoring in order to retain value over time.
What even is the price of a drug?
What started out as a story about a single month’s NADAC observations (exciting, we know) eventually became a conversation about other drug pricing benchmarks and their ability to measure drug costs. As we’ve said before, when there are dozens of different prices for a drug, there is effectively no such thing as the price for a drug. The mystery of U.S. drug pricing enables those “in the know” to leverage that knowledge to make money on those less informed and less able to freely shop than themselves. After all, where there is mystery there is margin, and undoubtedly there is a lot mystery when it comes to U.S. drug pricing.