
The fallout of March drug price changes
The CLIFF NOTES
As a non-profit, we at 46brooklyn have made it our goal to provide insights into U.S. drug pricing data available in the public domain based on the figures we’re able to gather and evaluate over the course of the year. Today’s report covers the drug pricing activity over the month of March 2024, with insights coming from our updated Brand Drug List Price Change Box Score, NADAC Drug Pricing Dashboard, and NADAC Change Packed Bubble Chart.

Last month’s report, which covered February, was light on the number of brand drug price changes (but at least one made a splash), but delivered some much loved generic drug price decreases. However, the fallout of this month’s look at March has us questioning which direction drug pricing is going (and it wouldn’t be the first time nor are we alone in doing it). As always, its too soon to tell if it is the generic drug pricing apocalypse, but there’s always time to prepare a vault.
So if all you’re looking for the speed run description of what happened in drug pricing for March, well there you go. If you’re interested in the details, then nod your Vault Boy bobblehead and read on to see what our Vault Leadership prepared.
What we saw from brand-name medications
1. A small number of brand drug list price changes
There were a total of 36 brand-name medications that saw wholesale acquisition cost (WAC) price increases in March and two list price decreases, which is all featured and contextualized in our Brand Drug List Price Change Box Score.
List price changes ranged from -51.8% to +58.2% and impacted $527 million in prior year gross Medicaid expenditures (PYME). As a reminder, February saw brand changes impacting over $110 million in PYME, so this roughly 5-times greater than last month (but 60-times less than January). Keep in mind when reviewing brand price increases in Medicaid that they are largely held in check thanks to the Medicaid Drug Rebate Program (MDRP), which includes rebate penalties for drug price increases that occur faster than the rate of inflation.
Almost all of the PYME value for this month comes for the list pricing changes on Keytruda, which took a 2% increase. Keytruda – Merck's most important revenue driver over the past few years – had over $300 million PYME (roughly 60% of the entire month’s activity). When it comes to drug pricing, or protagonists in a video game, one drug can make a big impact (see insulin price decreases at the start of the year).
2. Brand price trends over time
In comparison to the month of March in prior years, this month is about average, although March doesn’t really seem to have a trend for brand name drugs. March 2023 saw 16 net brand price increases (combined increases and decreases), or roughly half the amount observed this year. In comparison, March 2022 saw 64 (or double). However, that’s just the number of price changes. The impact of this March is largely in line with 2023 (approximately $600 PYME), but a lot larger than 2022 (which was just $162 million).
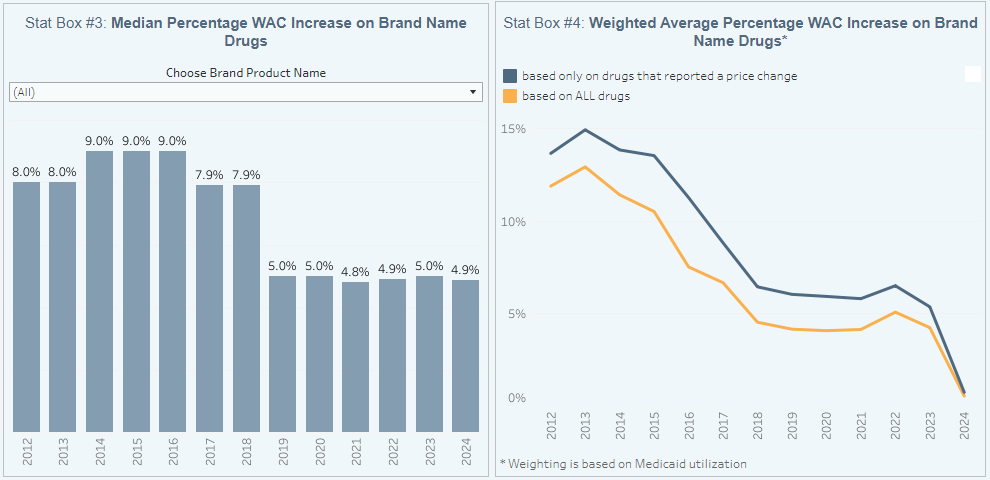
Figure 1
Source: Elsevier Gold Standard Drug Database, CMS State Drug Utilization Data, 46brooklyn Research
When further examining our brand drug box score visualization, there was no real movement on the median price change measure, which stayed at 4.9% (Figure 1). As a reminder, this is calculated based upon just brand drugs taking a price change (i.e., zeros are not included in our median measure). As can be seen in Stat Box #4 in our Brand Drug List Price Change Box Score, the weighted average list price increase of all brand drugs stayed at a historically low 0.8% for the year (Figure 1). By both annual measures, these are still among the lowest data points we’ve tracked in over a decade of brand drug list price changes.
As we said last month, this is a signal that the individual drugs in March are not that impactful (not affecting the yearly average impact of price changes) relative to the drug prices that have already occurred throughout the year.
3. Brand drug list price changes worth taking note of in March
We identify specific brand drugs worth taking note of in a couple different ways. Primarily, we look for medications with a lot of prior year gross Medicaid expenditures (PYME). We next look for drugs with large pricing changes (+/- 10%). And finally, we look for drugs that are interesting for us either because we’ve previously written on them, they’ve recently been in the news, or because we find them of unique clinical value. This month, when looking for these drugs in the brand arena, we found many worth mentioning (these are gross expenditures; actual net costs are likely much lower):
Gloperba (colchicine oral solution) is a medication used to prevent gout attacks. The medication took a 58.2% list price increase, the highest of the month and one of the highest of the year so far. Likely because it’s a re-formulation (oral solution) of a drug that already has generic versions, this medication had $0 known gross spending in Medicaid spend last year. Speculating on why this drug may have increased in price is always risky business, but Scilex recently announced (Dec. 2023) the results of market research demonstrating the ability to adjust the dose in persons with renal impairment and the desire to seek approval from the FDA to modify the labeling of the product to reflect this “unmet medical need.“
Duaklir Pressair (aclidinium and formoterol inhaler) is a medication used for the maintenance treatment of the lung condition of Chronic Obstructive Pulmonary Disease (COPD). This medication took a -51.8% list price decrease in March, the biggest decrease of the month (and one of the biggest of the year). In 2022, AstraZeneca transferred the rights of this product to Covis Pharma. The combination inhaler market is largely mature, and increasingly full of generic drugs, meaning that the spending on this drug has largely been limited (as represented by this drug also having $0 known PYME). Why the product is getting cheaper is anyone’s guess. The product has no historic price increases, so unlike other brands that may have been responding to AMP-cap removal, that does not seem to be an explanation for this drug.
Keytruda (pembrolizumab) is a medication used to treat various kinds of cancer (skin, lung, blood, gastric, etc.). This product took a +2% list price increase, but that impact is going to be felt across $300+ million in PYME. The extent of the expenditures on this drug speak to its relative importance as a cancer drug, often recommended within NCCN guidelines as a first or early line treatment.
Bear in mind that as you read these brand drug numbers, they are the prices before drug maker rebates are accounted for, which as we know are growing significantly over time and are at their largest amounts in the Medicaid and 340B programs. While these list prices are bloated and intended to be negotiated, for those who are underinsured, uninsured, or in high-deductible health plans, these “fake” list prices become very real.
What we saw from generic medications
4. An unfavorable, unweighted price change picture
Each month, we look at how many generic drugs went up and down in the latest month’s survey of retail pharmacy acquisition costs (based on National Average Drug Acquisition Cost, NADAC), and compare that to the prior month.
Basically, the quick way to read Figure 2 is to look for blue bars that are taller than orange bars to the left of the dotted line, and exactly the opposite to the right of the dotted line. That would indicate a good month – more generic drugs going down in price compared to the prior month, and less drug prices going up.
Figure 2
Source: Data.Medicaid.gov, 46brooklyn Research
We didn’t see that trend this month. In fact, it was pretty obvious that generic drug pricing didn’t move broadly in the manner of favoring decreased costs. For every generic drug that had a decrease in cost in March, 1.6 increased in cost. But as usual, take this unweighted price change analysis with a grain of salt. To really make heads or tails of all of these pricing changes, let’s weight these changes.
5. Weighted Medicaid generic drug costs come in at $73 million inflation
While you can track each drug’s NADAC over time at our NADAC Drug Pricing Dashboard, the purpose of our NADAC Change Packed Bubble Chart is to apply utilization (drug mix) to each month’s NADAC price changes to better assess the impact. We use Medicaid’s Q4 2022 and Q1-Q3 2023 drug mix from CMS to arrive at an estimate of the total dollar impact of the latest NADAC pricing update. As a reminder, we’re choosing the last full year picture available in order to remove variances in drug mix from this equation (and focus just on the role of NADAC price changes play over time). This helps quantify what should be the real effect of those price changes above from a payer’s perspective (in our case Medicaid; individual results will vary). Said differently, if a drug that is hardly ever utilized takes a 50% decrease, it doesn’t matter as much if a drug everyone takes increases by 5% (the inverse of this is what we observed at the start of the year with the brand name insulin price decreases [see our prior report]).
The green bubbles on the right of the Bubble Chart viz (screenshot below in Figure 3) are the generic drugs that experienced a price decline (i.e. got cheaper) in the latest NADAC survey, while the yellow/orange/red bubbles on the left are those drugs that experienced a price increase. The size of each bubble represents the dollar impact of the drug on state Medicaid programs, based on their utilization of the drugs in the most recent trailing 12-month period (i.e. bigger bubbles represent more spending). Stated differently, we simply multiply the latest survey price changes by aggregate drug utilization in Medicaid over the past full year, add up all the bubbles, and get the total inflation/deflation impact of the survey changes.

Figure 3
Source: Data.Medicaid.gov, 46brooklyn Research
Overall, in March, there was just over $120 million worth of inflationary drugs, but that was partly offset by just over $50 million of deflationary generic drugs, netting out to approximately $73 million of generic drug cost inflation for Medicaid. Compare to last month, which was deflationary, this means a lot of heavily utilized generic drugs for the U.S. got more expensive in March.
6. Year-over-year generic oral solid deflation declines to 3.4%
Ever since June 2020, we have been tracking year-over-year generic deflation for all generic drugs that have a NADAC price. We once again weight all price changes using Medicaid’s drug utilization data. This month, deflation on oral solid generics and all generics decreased to 5.4% and 3.4%, respectively (Figure 4). If you are a purchaser of generic drugs (based on the actual costs of drugs; not AWP, silly), an increase in this metric is ideal as it means costs are declining. Historically, these numbers have been much higher; however, this month represents a backwards (of course only time will tell if future months hold the same price decreases).
Figure 4
Source: Data.Medicaid.gov, 46brooklyn Research
A closer observation of the figure above shows that the averages for all generics and oral solids are not trending well for generic drugs over time. Back in 2021 and 2022, monthly generic deflation routinely and consistently eclipsed 10%. However, since the pandemic it seems that the ability for generic drugs to deflate has faced headwinds. In 2023, the yearly average generic oral solid deflation was 6% and thus far for 2024, oral solid deflation is closer to 4%.

Figure 5
Source: Data.Medicaid.gov, 46brooklyn Research

Looking at some of the drivers of this behavior, we dusted off our Abnormal Drug Price Increase Tracker (ADPIT), which shows drugs like albuterol and amoxicillin have been trending in the wrong direction for awhile now (Figures 6 & 7).
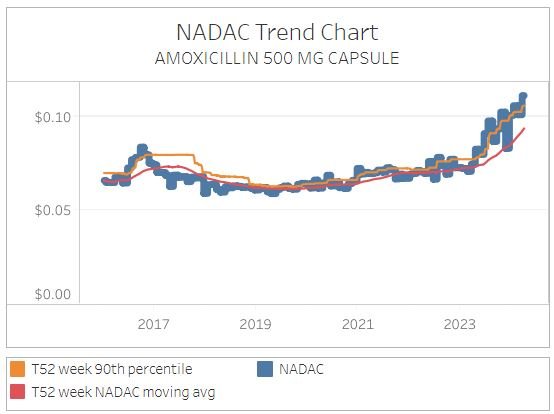
Figure 6
Source: Data.Medicaid.gov, 46brooklyn Research
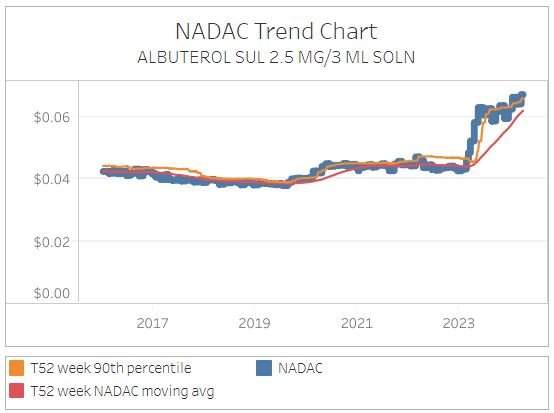
Figure 7
Source: Data.Medicaid.gov, 46brooklyn Research
Now, CMS is instituting methodology changes to NADAC for April 2024, so we will have to wait to see how those NADAC methodology changes impact generic deflation for the rest of the year, but there seems to be room for improvement.
7. Top/notable generic drug decreases
There are several generic drug price decreases this month.
The biggest decrease was for the heart medication, amiodarone 400 mg, which decreased 74%.
Medicaid programs are likely to see the greatest savings related to guanfacine 1 mg, which took a 14% decrease (but that decrease impacts roughly 908K prescriptions annually in the program).
Finally, we’d note that an old favorite, the expensive form of extended release metformin (gastric tablet) 1,000 mg decreased 40% (down to $1.30 per tablet).
8. Top/notable generic drug increases
On the increase side of things, we noticed that desipramine 25 mg saw a NADAC price increase of 102%, the highest of the month. Fortunately, it is largely a drug that has very little annual utilization (and expenditures).
More consequential to the Medicaid program (and any program that pays for drugs based on NADAC) are the 44.5% increase to NADAC for dexmethylphenidate ER 10 mg and the 32.5% increase to isotretinoin 30 mg. Both of these drug changes are anticipated to increase drug costs by $3 million on an annualized basis (if the price changes hold).
That’s the fallout for this month. War never changes, but drug prices do.
Ed Silverman at STAT News had some great attention to detail in last month’s drug pricing report, as he flagged the 486% list price increase of the injectable eye medication Triesence and did some solid researching and commentary on the price hike and the overarching dynamics of public policy’s impact on marketplace behavior. Big shout-out to Brian Reid at the indispensable Cost Curve News for diving into how the shadow of the Inflation Reduction Act plays into manufacturer pricing decisions.
Amidst the heightened awareness of plan sponsor fiduciary obligations to employees when it comes to benefits design, Mary Caffrey and Julia Bonavitacola at the American Journal of Managed Care Pharmacy dig into the implications of the bellwether Lewandowski v Johnson and Johnson et al lawsuit that puts PBM pricing controversies under the legal spotlight.
Last fall, our team worked with the Wall Street Journal to illuminate the massive mark-ups that big PBMs were slathering on top of cheap generic “specialty” drugs relative to costs at Mark Cuban Cost Plus Drug Company. The findings prompted Senators Elizabeth Warren and Mike Braun to call for an investigation into the pricing dynamics by the Office of Inspector General. This month, WSJ’s Jennifer Calfas reported that the OIG announced that the probe is on.
For you podcast fans, we highly recommend this excellent discussion between 46brooklyn CEO Antonio Ciaccia and the team of Mark Hansan and Scott Howell at the Prescription for Better Access podcast for an extensive discussion on the 340B program and its fueling through money from sick people.