
Valentines from the drug channel?
The CLIFF NOTES
As a non-profit, we at 46brooklyn have made it our goal to provide insights into U.S. drug pricing data available in the public domain based on the figures we’re able to gather and evaluate over the course of the year. Today’s report covers the drug pricing activity over the month of February 2024, with insights coming from our updated Brand Drug List Price Change Box Score, NADAC Drug Pricing Dashboard, and NADAC Change Packed Bubble Chart.
Last month’s report, which covered the saw a bunch of drug price increases that took a while to digest (not the millennia of a sarlacc pit, but close). We say this because last month we saw not only the typical brand name drug list increases that start every year, but also saw some significant generic drug cost increases leading to a month that was just an overall high month for drug price changes. However, February (which this report covers) brought us some drug pricing love — few brand drug price increases (on generally low utilization drugs) and a lot (like a ton) of generic drug cost decreases.
So if all you’re looking for is a brief description of what happened in drug pricing for the shortest month of the year, well there you go. If you’re interested in the details, then read on to see our full analysis of February 2024 and to see where Cupid spread the drug pricing love.
What we saw from brand-name medications
1. A small number of brand drug list price changes
There were a total of 38 brand-name medications that saw wholesale acquisition cost (WAC) price increases in February and one list price decrease, which is all featured and contextualized in our Brand Drug List Price Change Box Score.
List price changes ranged from -10% to 486% and impacted $110 million in prior year gross Medicaid expenditures (PYME). As a reminder, January saw brand changes impacting over $30 billion in PYME, so this is a very, very small month in terms of impact to gross Medicaid expenditures. Keep in mind when reviewing brand price increases in Medicaid that they are largely held in check thanks to the Medicaid Drug Rebate Program (MDRP), which includes rebate penalties for drug price increases that occur faster than the rate of inflation.
2. Brand price trends over time
In comparison to prior Februarys, this month is about average. February 2023 saw 54 net brand price increases (combined increases and decreases) whereas February 2022 saw 43. However, that’s just the number of price changes. The impact of this February is likely smaller as measured by its impact to expenditures. Both 2023 and 2022 February price increases impacted roughly $300 million in Medicaid drug spend whereas this year is roughly a third of that. This is likely a function of both the mix of drugs taking a price increase but also the increasing use of generic drugs within the Medicaid program over time.
When further examining our brand drug box score visualization, we also see February price changes push the median price increase from 4.7% up to 4.9%. As a reminder, this is calculated based upon just brand drugs taking a price change (i.e., zeros are not included in our median measure).

Figure 2
Source: Elsevier Gold Standard Drug Database, CMS State Drug Utilization Data, 46brooklyn Research
When weighting all the list price changes against prior year gross Medicaid expenditures (as tracked by CMS State Drug Utilization Data), we can see the relative insignificance of February price changes (Figure 2).
As can be seen in Stat Box #4 in our Brand Drug List Price Change Box Score, the weighted average list price increase of all brand drugs stayed at a historically low 0.7% for the year. This is a signal that despite there being relatively the same numerical count of brand changes in this February as prior Februarys, the individual drugs are not impactful (not affecting the average).
Recall that in reviewing Figure 2, the math is heavily influenced by a number of brand drugs that took a price decrease in January 2024 (most likely due to the removal of Medicaid rebate caps). Those drugs impacted some of the most heavily utilized brands and so they’re having a significant impact on our weighted average measure here.
3. Brand drug list price changes worth taking note of in February
We identify specific brand drugs worth taking note of in a couple different ways. Primarily, we look for medications with a lot of prior year gross Medicaid expenditures (PYME). We next look for drugs with large pricing changes (+/- 10%). And finally, we look for drugs that are interesting for us either because we’ve previously written on them, they’ve recently been in the news, or because we find them of unique clinical value. This month, when looking for these drugs in the brand arena, we found many worth mentioning (these are gross expenditures; actual net costs are likely much lower):
Triesence (triamcinolone acetonide injectable suspension) is an injection for the eye to treat sympathetic ophthalmia, temporal arteritis, uveitis, and ocular inflammatory conditions unresponsive to topical corticosteroids as well as visualization during vitrectomy. This drug has the distinction of being one of the highest brand name drug list price increases we have ever observed, going up 486% in its WAC price (the drug last took a price increase in January 2023). The rationale for this price increase appears to be multifactorial. First, Triesence was a product previously owned by drug manufacturer Novartis, but was acquired by Harrow in January 2023. In November 2023, Harrow announced it had finally completed the transfer of the New Drug Application (NDA) for Triesence, thus setting the table for its re-launch under the Harrow umbrella. Harrow expected its acquisition of this (and another four eye drugs) to catapult “Harrow into a leadership position in the U.S. ophthalmic pharmaceuticals market.” A July 2023 acquisition of Santen’s ophthalmic portfolio further cemented Harrow’s market positioning in ways that were expected “to be immediately financially accretive“ for the company. At the same time, the drug has faced recent shortages due to “manufacturing delays related to good manufacturing practices.” Complying with U.S. drug laws can be expensive and so we assume the ~5x increase in price is related to these (and potentially other) factors. Amid Harrow’s optimistic outlook for revenues in the coming year, they reported that Triesence is expected to return to the market soon. In a March 19, 2024 letter to stockholders, Harrow gives some insights on the manufacturing hurdles, and explains that the “price adjustment reflects, in part, inflation and increased regulatory and manufacturing costs during the more than 16 years since the price of TRIESENCE was last adjusted.” In their March 2024 earnings call, Harrow disclosed that their $944 WAC price has a gross-to-net element,” indicating that there is a noteworthy amount of discounts off the list price intended to ensure patient access to the medicine. These tidbits aside, this drug impacts roughly $408K in PYME, which would expect to grow considerably given the drug’s list price increase and the company’s growth outlook.
Krystexxa (pegloticase) is an injection for the treatment of chronic gout in adult patients refractory to conventional therapy. While it took a modest WAC increase of 2.4% (at least in comparison to the median of 4.9%), it does impact roughly $37 million in PYME, making it the potentially highest gross cost price increase in February. In November, manufacturer Amgen announced new data, “showing a decrease in blood pressure during treatment of adults living with chronic gout refractory to oral urate-lowering treatment − uncontrolled gout − both with and without chronic kidney disease (CKD).” Krystexxa was part of the portfolio of drugs Amgen inherited in its acquisition of Horizon that closed in October 2023.
Keveyis (dichlorphenamide) are tablets used for the treatment of primary hyperkalemic periodic paralysis, primary hypokalemic periodic paralysis, and related variants. This product took a WAC price increase of 14.7%, impacting approximately $6 million in PYME. You might recall Keveyis under its former name Daranide, whose pricing has been under some scrutiny in the past. A generic for this product was finally approved last year; however, that generic does not seem to be having much market penetration yet, as evidenced by it not have a NADAC price point yet (despite being an oral tablet), and so the cost of the product from the one generic manufacturer doesn’t seem to have impacted the overall cost of therapy with this drug very much. Since Keveyis is a product with a price of roughly $40K per 100 tablets, we hope to see the market-clearing rate for the drug to come down further in the coming years given the added competition.
Bear in mind that as you read these brand drug numbers, they are the prices before drugmaker rebates are accounted for, which as we know are growing significantly over time and are at their largest amounts in the Medicaid and 340B programs. While these list prices are bloated and intended to be negotiated, for those who are underinsured, uninsured, or in high-deductible health plans, these “fake” list prices become very real.
What we saw from generic medications
4. A pretty favorable, unweighted price change picture
Each month, we look at how many generic drugs went up and down in the latest month’s survey of retail pharmacy acquisition costs (based on National Average Drug Acquisition Cost, NADAC), and compare that to the prior month.
Basically, the quick way to read Figure 3 is to look for blue bars that are taller than orange bars to the left of the dotted line, and exactly the opposite to the right of the dotted line. That would indicate a good month – more generic drugs going down in price compared to the prior month, and less drug prices going up.
Figure 3
Source: Data.Medicaid.gov, 46brooklyn Research
As our introduction alluded to, this is exactly what we’re seeing in Figure 3. For every generic drug that had an increase in cost in February, 1.7 decreased in cost. But as usual, take this unweighted price change analysis with a grain of salt. To really make heads or tails of all of these pricing changes, let’s weight these changes.
5. Weighted Medicaid generic deflation comes in at $55 million
While you can track each drug’s NADAC over time at our NADAC Drug Pricing Dashboard, the purpose of our NADAC Change Packed Bubble Chart is to apply utilization (drug mix) to each month’s NADAC price changes to better assess the impact. We use Medicaid’s 2022 drug mix from CMS to arrive at an estimate of the total dollar impact of the latest NADAC pricing update. As a reminder, we’re choosing the last full year picture available in order to remove variances in drug mix from this equation (and focus just on the role of NADAC price changes play over time). This helps quantify what should be the real effect of those price changes above from a payer’s perspective (in our case Medicaid; individual results will vary). Said differently, if a drug that is hardly ever utilized takes a 50% decrease, it doesn’t matter as much if a drug everyone takes increases by 5% (the inverse of this is what we observed at the start of the year with the brand name insulin price decreases [see our prior report]).
The green bubbles on the right of the Bubble Chart viz (screenshot below in Figure 4) are the generic drugs that experienced a price decline (i.e. got cheaper) in the latest NADAC survey, while the yellow/orange/red bubbles on the left are those drugs that experienced a price increase. The size of each bubble represents the dollar impact of the drug on state Medicaid programs, based on their utilization of the drugs in the most recent trailing 12-month period (i.e. bigger bubbles represent more spending). Stated differently, we simply multiply the latest survey price changes by aggregate drug utilization in Medicaid over the past full year, add up all the bubbles, and get the total inflation/deflation impact of the survey changes.
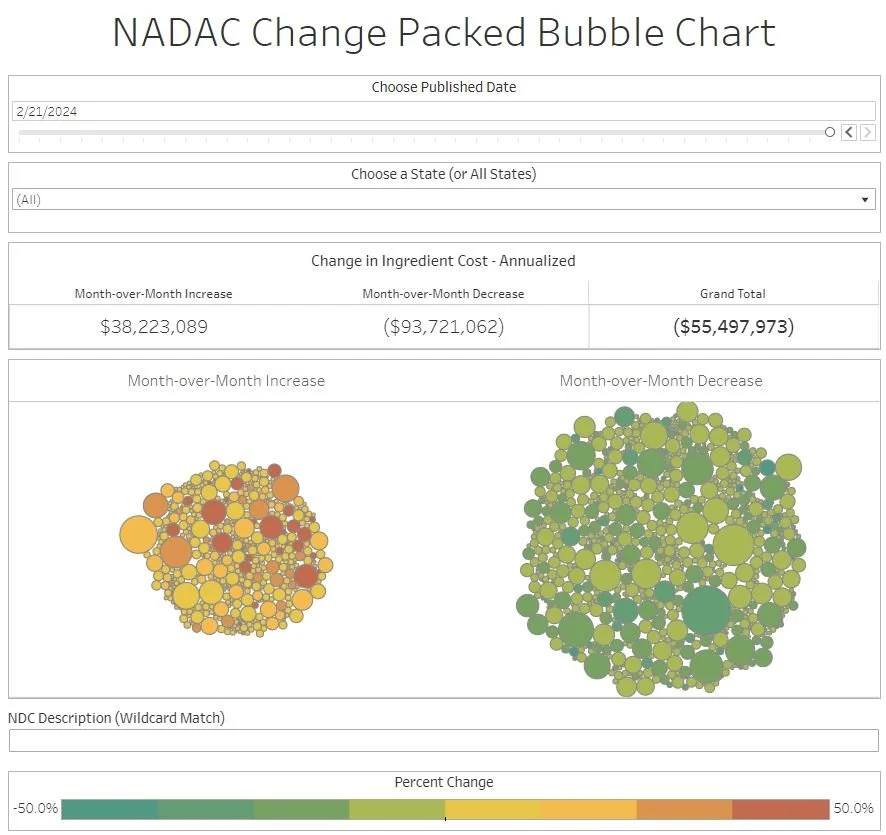
Figure 4
Source: Data.Medicaid.gov, 46brooklyn Research
Overall, in February, there was just over $38 million worth of inflationary drugs, but that was more than offset by just over $93 million of deflationary generic drugs, netting out to approximately $55 million deflation for Medicaid. Compare to last month, which was almost a wash (slight inflation), this means a lot cheaper generic drugs for the U.S.
6. Year-over-year generic oral solid deflation hits 9.5%
Ever since June 2020, we have been tracking year-over-year generic deflation for all generic drugs that have a NADAC price. We once again weight all price changes using Medicaid’s drug utilization data. This month, deflation on oral solid generics and all generics increased to 9.5% and 6.7%, respectively (Figure 5). If you are a purchaser of generic drugs (based on the actual costs of drugs; not AWP, silly), an increase in this metric is ideal as it means costs are declining. Historically, these numbers have been much higher; however, this month represents a good month in potentially reversing this trend (of course only time will tell if future months hold the same price decreases).
Figure 5
Source: Data.Medicaid.gov, 46brooklyn Research
7. Top/notable generic drug decreases
There are several generic drug price decreases this month.
The biggest decreases are for the antipyschotic, olanzapine ODT 20 mg, which decreased 46.6%.
Medicaid programs are likely to see the greatest savings related to the antidepressant, bupropion XL 300 mg, which took a 27% decrease (but that decrease impacts roughly 1.5 million prescriptions annually in the program).
Finally, we’d note that the gastrointestinal agent, mesalamine DR 800 mg took a 20% decrease. Ulcerative colitis, a condition for which the product is used to treat, is often very expensive for patients and so price decreases for this drug should hopefully come with additional financial savings to patients (depending of course on how their insurer prices their generics).
8. Top/notable generic drug increases
On the increase side of things, we noticed that albendazole 200 mg saw a NADAC price increase of 47.5%. This drug is notable as it was the first product launched by the Mark Cuban Cost Plus Drug Company (MCCPDPC) and while they’ve continued to make a bunch of waves in the drug pricing space, they’re also able to beat the NADAC cost of this drug by roughly 50% (i.e., if you buy one albendazole at the NADAC price, MCCPDC will sell you two for roughly the same cost).
Another drug whose price change caught our eye was clobazam 20 mg, which saw a 53% price increase. As a medication to treat seizure, being without this medication can be problematic and price increases may lead to affordability issues (again, depending upon how the patient’s insurer prices generics). There were some reports of clobazam shortages across the world in 2023, and so maybe this pricing activity reflects the cost of ensuring access to the drug (but we’re only speculating).
That’s all for this month! Let’s hope that March is more like February than January when it comes to drug pricing activity.
Check out 46brooklyn CEO Antonio Ciaccia at last month’s special event from The Hill entitled Prescribing PBM Reform: Accelerating Transparency with Bipartisan Action.
Thanks to Ngozi Cole at WYSO Dayton for chatting with us about the recent uptick in pharmacy closures.
Lastly, this month’s additions to our Money from Sick People series generated a lot of buzz and online chatter. In case you didn’t see them, our second installment that focused on the flow of dollars in the 340B program can be found here, and our third installment which examined the attitudes and incentives of key stakeholders in the drug transaction as it pertains to prescription drug rebates and discounts can be found here. William Newton at the 340B Report has a write-up on our analysis here.