
Number of 2021 brand drug list price increases about to surpass 2020's total
The CLIFF NOTES
You know that feeling when you put everything you have into some competitive activity, do your absolute best, take pride in your accomplishment for a minute or two… until you are absolutely trounced by someone else? It’s happened to all of us sometime in our life… well maybe all of us except hot dog eating champion Joey Chestnut.
If 2020 brand drug price increases had feelings, we assume that right about now they would feel like one of Mr. Chestnut’s chow-down competitors. Brand drug manufacturers put up an impressive 1,063 net list price increases in 2020, which as we have shown is historically on the low side of what we’ve come to expect. In fact, on the whole, 2020’s increases represented the lowest total in a decade. But still, we’re talking about more than 1,000 price increases on brand name drugs, impacting nearly 70% of Medicaid’s brand drug utilization. All things considered, that’s not a “bad showing.” But 2021 has quickly obliterated any pride 2020 took in its low number of list price increases, posting 1,058 net increases in just over four months. Back to our competitive eating analogy (because anything worth doing is worth overdoing), this is kind of like scarfing down 15 hot dogs, only to be followed by Joey Chestnut, who puts that many away well before even reaching the half-way point.
Of course, drug pricing analysis is not as simple as watching a hot dog eating competition. For example, some of the “hot dogs eaten” this year may be pigs in a blanket (i.e., small price increases), while in prior years, they were more along the lines of those foot-long hot dogs (i.e., very large price increases). The point is that the unweighted count of price increases is only one small piece of the full drug pricing picture, which is why we created our Brand Drug List Price Change Box-Score to provide a more holistic view of brand drug list price changes over time.

Further complicating matters is the fact that that big stack of dogs you’re staring at could be somewhat of an illusion. This is because studying list price increases alone is like judging a hot dog eating contest without actually making sure that there are hot dogs in the buns. Because of our highly complex system of drugmaker rebates, 340b discounts, and mounting middleman fees, list price increases are no guarantee that manufacturers are actually making more money. In fact, there is more and more and more and more and more evidence that in the aggregate, net prices for prescription drugs, at least from the drugmaker perspective, are falling.
Because these manufacturer price concessions are often purposely miscategorized and shuffled around by pharmacy benefit managers (PBMs), insurers, and now their “rebate aggregators” as a means to shield patients and plan sponsors from getting their hands them, the likelihood that you get the full benefit of those growing discounts is about the same likelihood of you taking home the first place trophy in the Buffalo Chicken Wing Eating Competition.
Despite all these caveats, we still view 2021 brand drug list price increases lapping those in 2020 as noteworthy enough to headline this report, if for no other reason than it shows an acceleration in the widening gap between the healthcare “haves” (those who either directly or indirectly get sizable rebates) and “have nots” (those that barely see the benefits of rebates at all, like patients in high deductible plans).
For those of you interested in more details on the brand drugs that moved in April, along with our standard recap on changes to surveyed generic drug acquisition costs (total Medicaid deflation in April was a measly $19 million, a number so relatively small that it is not even worthy of being presented outside of this parenthetical citation), the rest of this report is for you.
Brand Name Medications
1. Brand drug price changes worth taking note of in April
There were four brand list price decreases in April and 61 brand list price increases for a net total of 57 price increases. This is the third lowest total in April over the last decade. Nonetheless, it puts just a few more brand drug prices off the mark of eclipsing all of 2020, in less than half a year in 2021.
The price decreases occurred across Infuvite injectable vitamins and Lovenox solution for blood clots – products that have generic alternatives in the market. Combined, these products represented less than $5 million out of approximately $67 billion in total gross Medicaid expenditures last year.
The most significant list price increases, based upon the gross number of Medicaid dollars impacted are as follows:
Jakafi tablets, which saw an wholesale acquisition cost (WAC) increase of 4% across $131 million in gross annual Medicaid expenditures. Jakafi is a medication used to treat blood cancers.
Entyvio injection, which saw a WAC increase of 4% across $157 million in gross annual Medicaid expenditures. This medication is used to treat ulcerative colitis and Crohn’s disease.
Aristada injection, which saw a WAC increase of 3% across $296 million in gross annual Medicaid expenditures. This medication is used to treat schizophrenia.
Vivitrol injection, which saw a WAC increase of 2% across $403 million in gross annual Medicaid expenditures. This medication is used to treat opioid addiction.
Keytruda injection, which saw a WAC increase of 2% across $528 million in gross annual Medicaid expenditures. This medication is used to treat skin, lung, head, neck, blood, and stomach cancers.
All told, these five medications represent $1.5 billion in gross annual Medicaid expenditures. In total, all the April price increases touch $1.8 billion in Medicaid expenditures, meaning that these five are all that really matter to Medicaid.
As we have written about before, these price increases will largely be offset for Medicaid programs thanks to the Medicaid Drug Rebate Program (MDRP). Although the prices increase, so long as they do so faster than inflation, Medicaid gets protection from these price increases thanks to the CPI penalty cooked into the MDRP rebate formula. Of course, if inflation ticks up, Medicaid may lose the rebate price protections it has relied upon over the last decade. So we wait, along with our pharmacy director friends at Medicaid programs, to see whether inflation shows up in 2021.
Generic Medications
2. An unfavorable unweighted price change picture
Each month, we look at how many generic drugs went up and down in the latest month’s survey of retail pharmacy acquisition costs (based on National Average Drug Acquisition Cost, NADAC), and compare that to the prior month (Figure 1).
Basically, the quick way to read Figure 1 is to look for blue bars that are taller than orange bars to the left of the dotted line, and exactly the opposite to the right of the dotted line. That would indicate a good month – more generic drugs going down in price compared to the prior month, and less drug prices going up.
Figure 1
Source: Data.Medicaid.gov, 46brooklyn Research
So how did we do this month? Blue bars taller than orange bars to the left of dotted line? Nope. Blue bars shorter than orange bars to the right of dotted line? Nope, again. In other words, generic drug prices didn’t behave well this month, at least on an unweighted basis. Putting some numbers to this, for every drug that increased in price this month, only 0.97 decreased in price. That’s way down from a ratio of 1.32 last month.
But as usual, take this unweighted price change analysis with a grain of salt. To really make heads or tails of all of these pricing changes, let’s weight these changes.
3. Weighted Medicaid generic deflation comes in at $19 million
The purpose of our NADAC Change Packed Bubble Chart (Figure 2) is to apply utilization (drug mix) to each month’s NADAC price changes to better assess the impact. We use Medicaid’s 2019 drug mix from CMS to arrive at an estimate of the total dollar impact of the latest NADAC pricing update. This helps quantify what should be the real affect of those price changes from a payer’s perspective (in our case Medicaid; individual results may vary).
The green bubbles on the right of the Bubble Chart viz (screenshot below in Figure 2) are the generic drugs that experienced a price decline (i.e. got cheaper) in the latest survey, while the yellow/orange/red bubbles on the left are those drugs that experienced a price increase. The size of each bubble represents the dollar impact of the drug on state Medicaid programs, based on utilization of the drugs in the most recent trailing 12-month period (i.e. bigger bubbles represent more spending). Stated differently, we simply multiply the latest survey price changes by aggregate drug utilization in Medicaid over the past full year, add up all the bubbles, and get the total inflation/deflation impact of the survey changes.

Figure 2
Source: Data.Medicaid.gov, 46brooklyn Research
Overall, in April, there was $91 million worth of inflationary drugs, offset by $110 million of deflationary generic drugs, netting out to $19 million of deflation for Medicaid.
Before we dive into some of the specific drug details, we have one more top-down analysis to run – that is to investigate how generic drug prices are trending over time.
4. Year-over-year generic oral solid deflation eases to 17%
Ever since last June, we have been tracking year-over-year generic deflation for all generic drugs that have a NADAC price. We once again weight all price changes using Medicaid’s drug utilization data. Beginning in August 2019, we had been seeing a gradual compression in deflation (Figure 3). But oddly enough, looking back, the start of the pandemic turns out to have been the low point for generic deflation, with the deflationary trend rapidly moving upward ever since. However, this month, deflation took a break from its upward trend, decelerating to 17.1% year-over-year (YoY) on generic oral solids and 12.4% on all generic drugs. Oral solid generic deflation remains above the +1 standard deviation line.
Figure 3
Source: Data.Medicaid.gov, 46brooklyn Research
5. Top/notable generic drug decreases this month
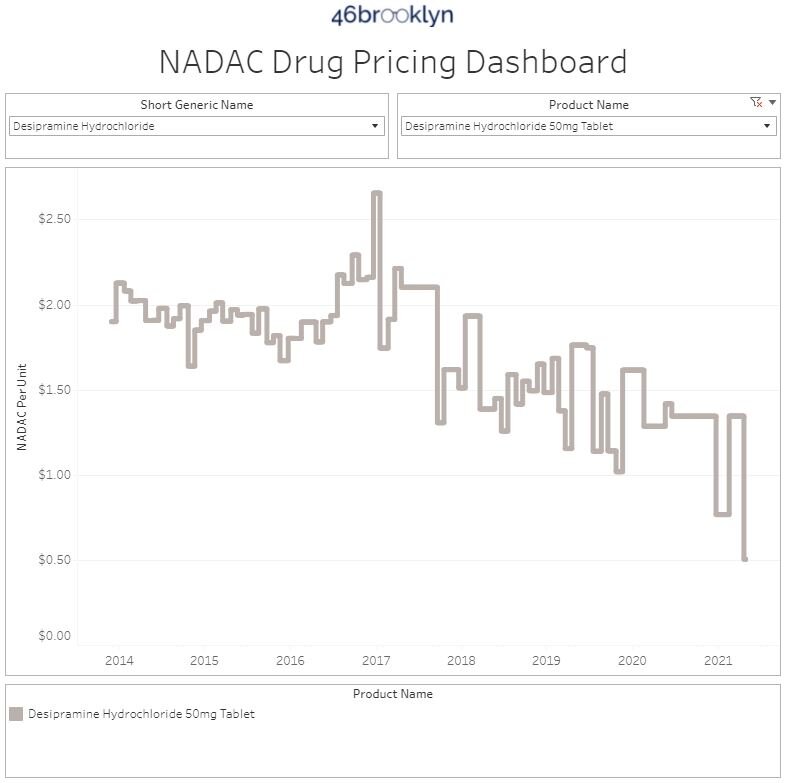
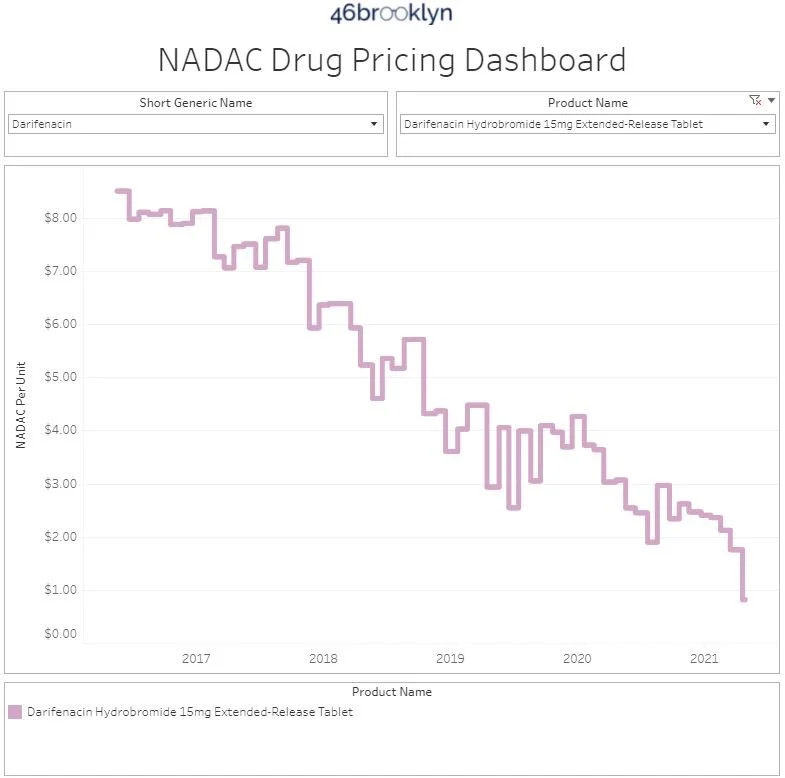
The most notable price decreases, aside from ADHD medications which always pop up in these monthly updates, are desipramine (generic for Norpramin) and darifenacin ER (generic for Enablex).
Desipramine is a medication for depression, although not a very popular one.
Darifenacin ER is a medication used to treat overactive bladder and is far more popular of a medication in Medicare than in Medicaid.
6. Top/notable generic drug increases
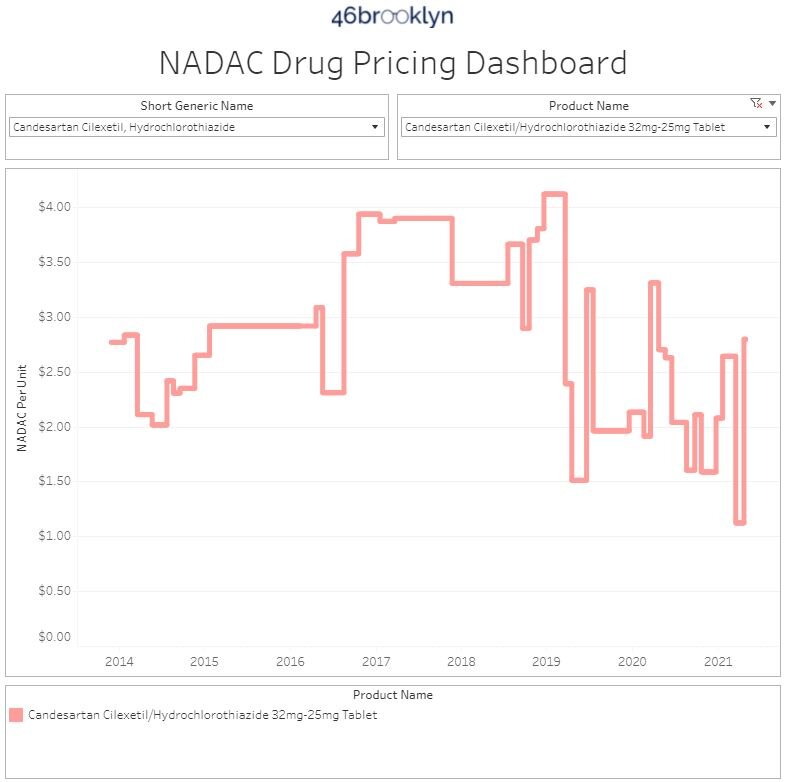
The most notable price increases were on candesartan-hydrochlorothiazide (generic for Atacand HCT) and norethindrone-ethinyl estradiol (generic for Femhrt).
Candesartan-hydrochlorothiazide is a medication used to control blood pressure.
Norethindrone-ethinyl estradiol is a medication used to treat symptoms of menopause
Generic price increases and decreases can be irregular when it comes to NADAC and can shift pretty quickly from month to month, that is part of why we developed ADPIT, to look more closely at outliers.
7. ADPIT (once again) gives us the “all clear” on extreme upward generic drug pricing movements
Finally, let’s check in on our Abnormal Drug Pricing Increase Tracker (ADPIT) and see what it has to say about this month’s data. As a reminder, ADPIT takes all of the NADAC prices for one drug over any given 52-week period, ranks them, finds the 90th percentile for the price, and then compares the current price to that 90th percentile price. If the current price is above the 90th percentile, we consider the current week’s price to be “abnormal” and add it to the list for you to peruse. Then we do this for another 20,000 or so drugs for good measure to complete the list, shown in Figure 4.
As we examined ADPIT this month, we once again were impressed by the extremely low overall Relative Impact Score (bottom right chart in Figure 4), which as a reminder is a unitless measure we created simply to size all of the abnormal upward pricing movements in generic drugs. This metric continues to hover at the lowest levels we’ve seen in the last three years, a very encouraging sign that there are very few ultra-inflationary retail generic drugs lurking in shadows of the murky U.S. drug supply chain.
Figure 4
Source: Data.Medicaid.gov, ClinicalTrials.gov, 46brooklyn Research
Thanks to Theresa O’Brien for highlighting some of our Medicaid drug pricing research and specifically, our work in Ohio, in her recent piece in the Lehigh Valley Press on the impact of PBMs in the pharmacy marketplace and in state Medicaid programs.
Big shout-out to Jacquie Lee at Bloomberg Law for her recent feature that digs into the nitty gritty details on federal efforts on drug pricing reform, and the need to look across the supply chain when evaluating priorities. We appreciate her explaining the industry dynamics that can yield great deals on medicine for some, but also horrible deals on medicine for others.
Lastly, we’ve got a couple podcast interviews to share. Thanks to Scott Kjelson at the Disruptive Front for having 46brooklyn CEO Antonio Ciaccia on to discuss some of the recent trends on drug prices and the need to reset the pharmacy incentive design. We’d also like to give a big shout-out to Dan Skinner, the host of Prognosis Ohio, where Ciaccia joined Loren Anthes with the Center for Community Solutions to discuss the ongoing Medicaid/pharmacy/PBM/insurer saga in Ohio, as well as policy strategies to lower prescription drug costs.